High purity, different amounts: two actual reports
Both certificates below identify tirzepatide and report high purity. The measured milligrams tell different stories. These examples illustrate how to read a report; they are not representative samples or vendor rankings.
Close to the labelled amount
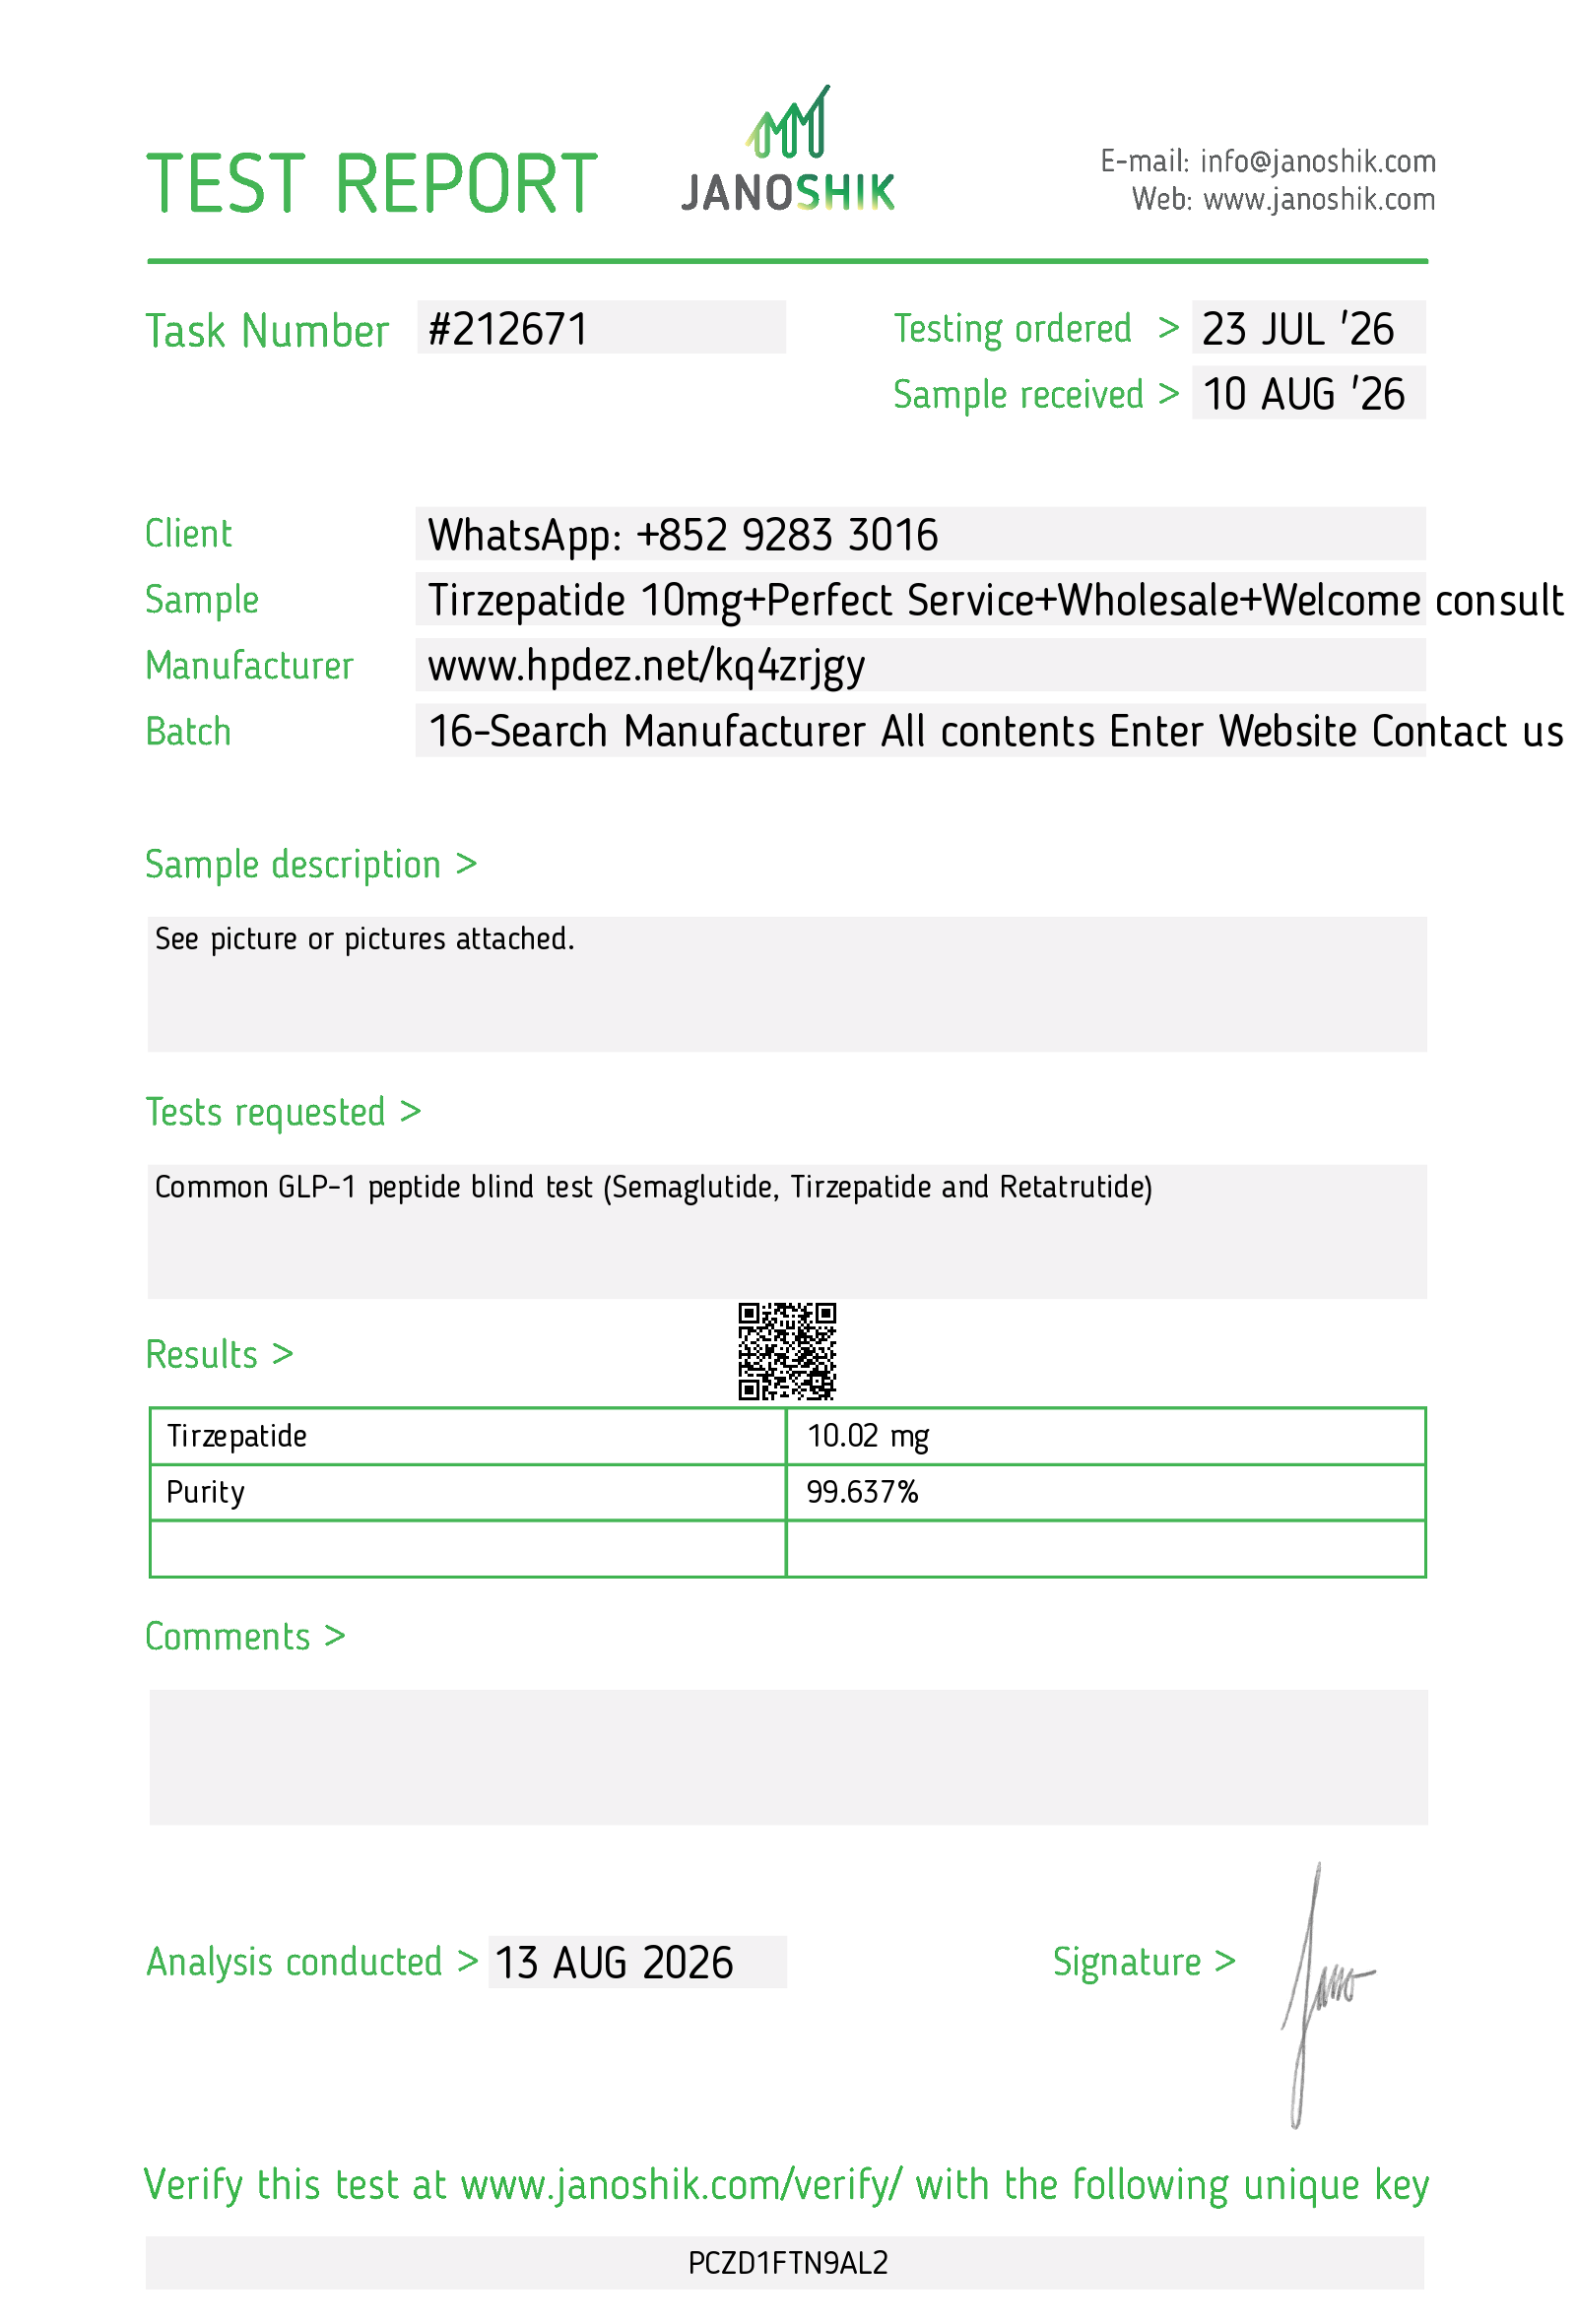
10mg labelled. 10.02mg measured. Purity was 99.637%. The measured amount was 0.2% above the claim.
The batch field contains promotional text rather than a clear lot identifier. A close amount match still leaves that traceability gap.
Janoshik #212671 · August 13, 2026High purity, but short on content
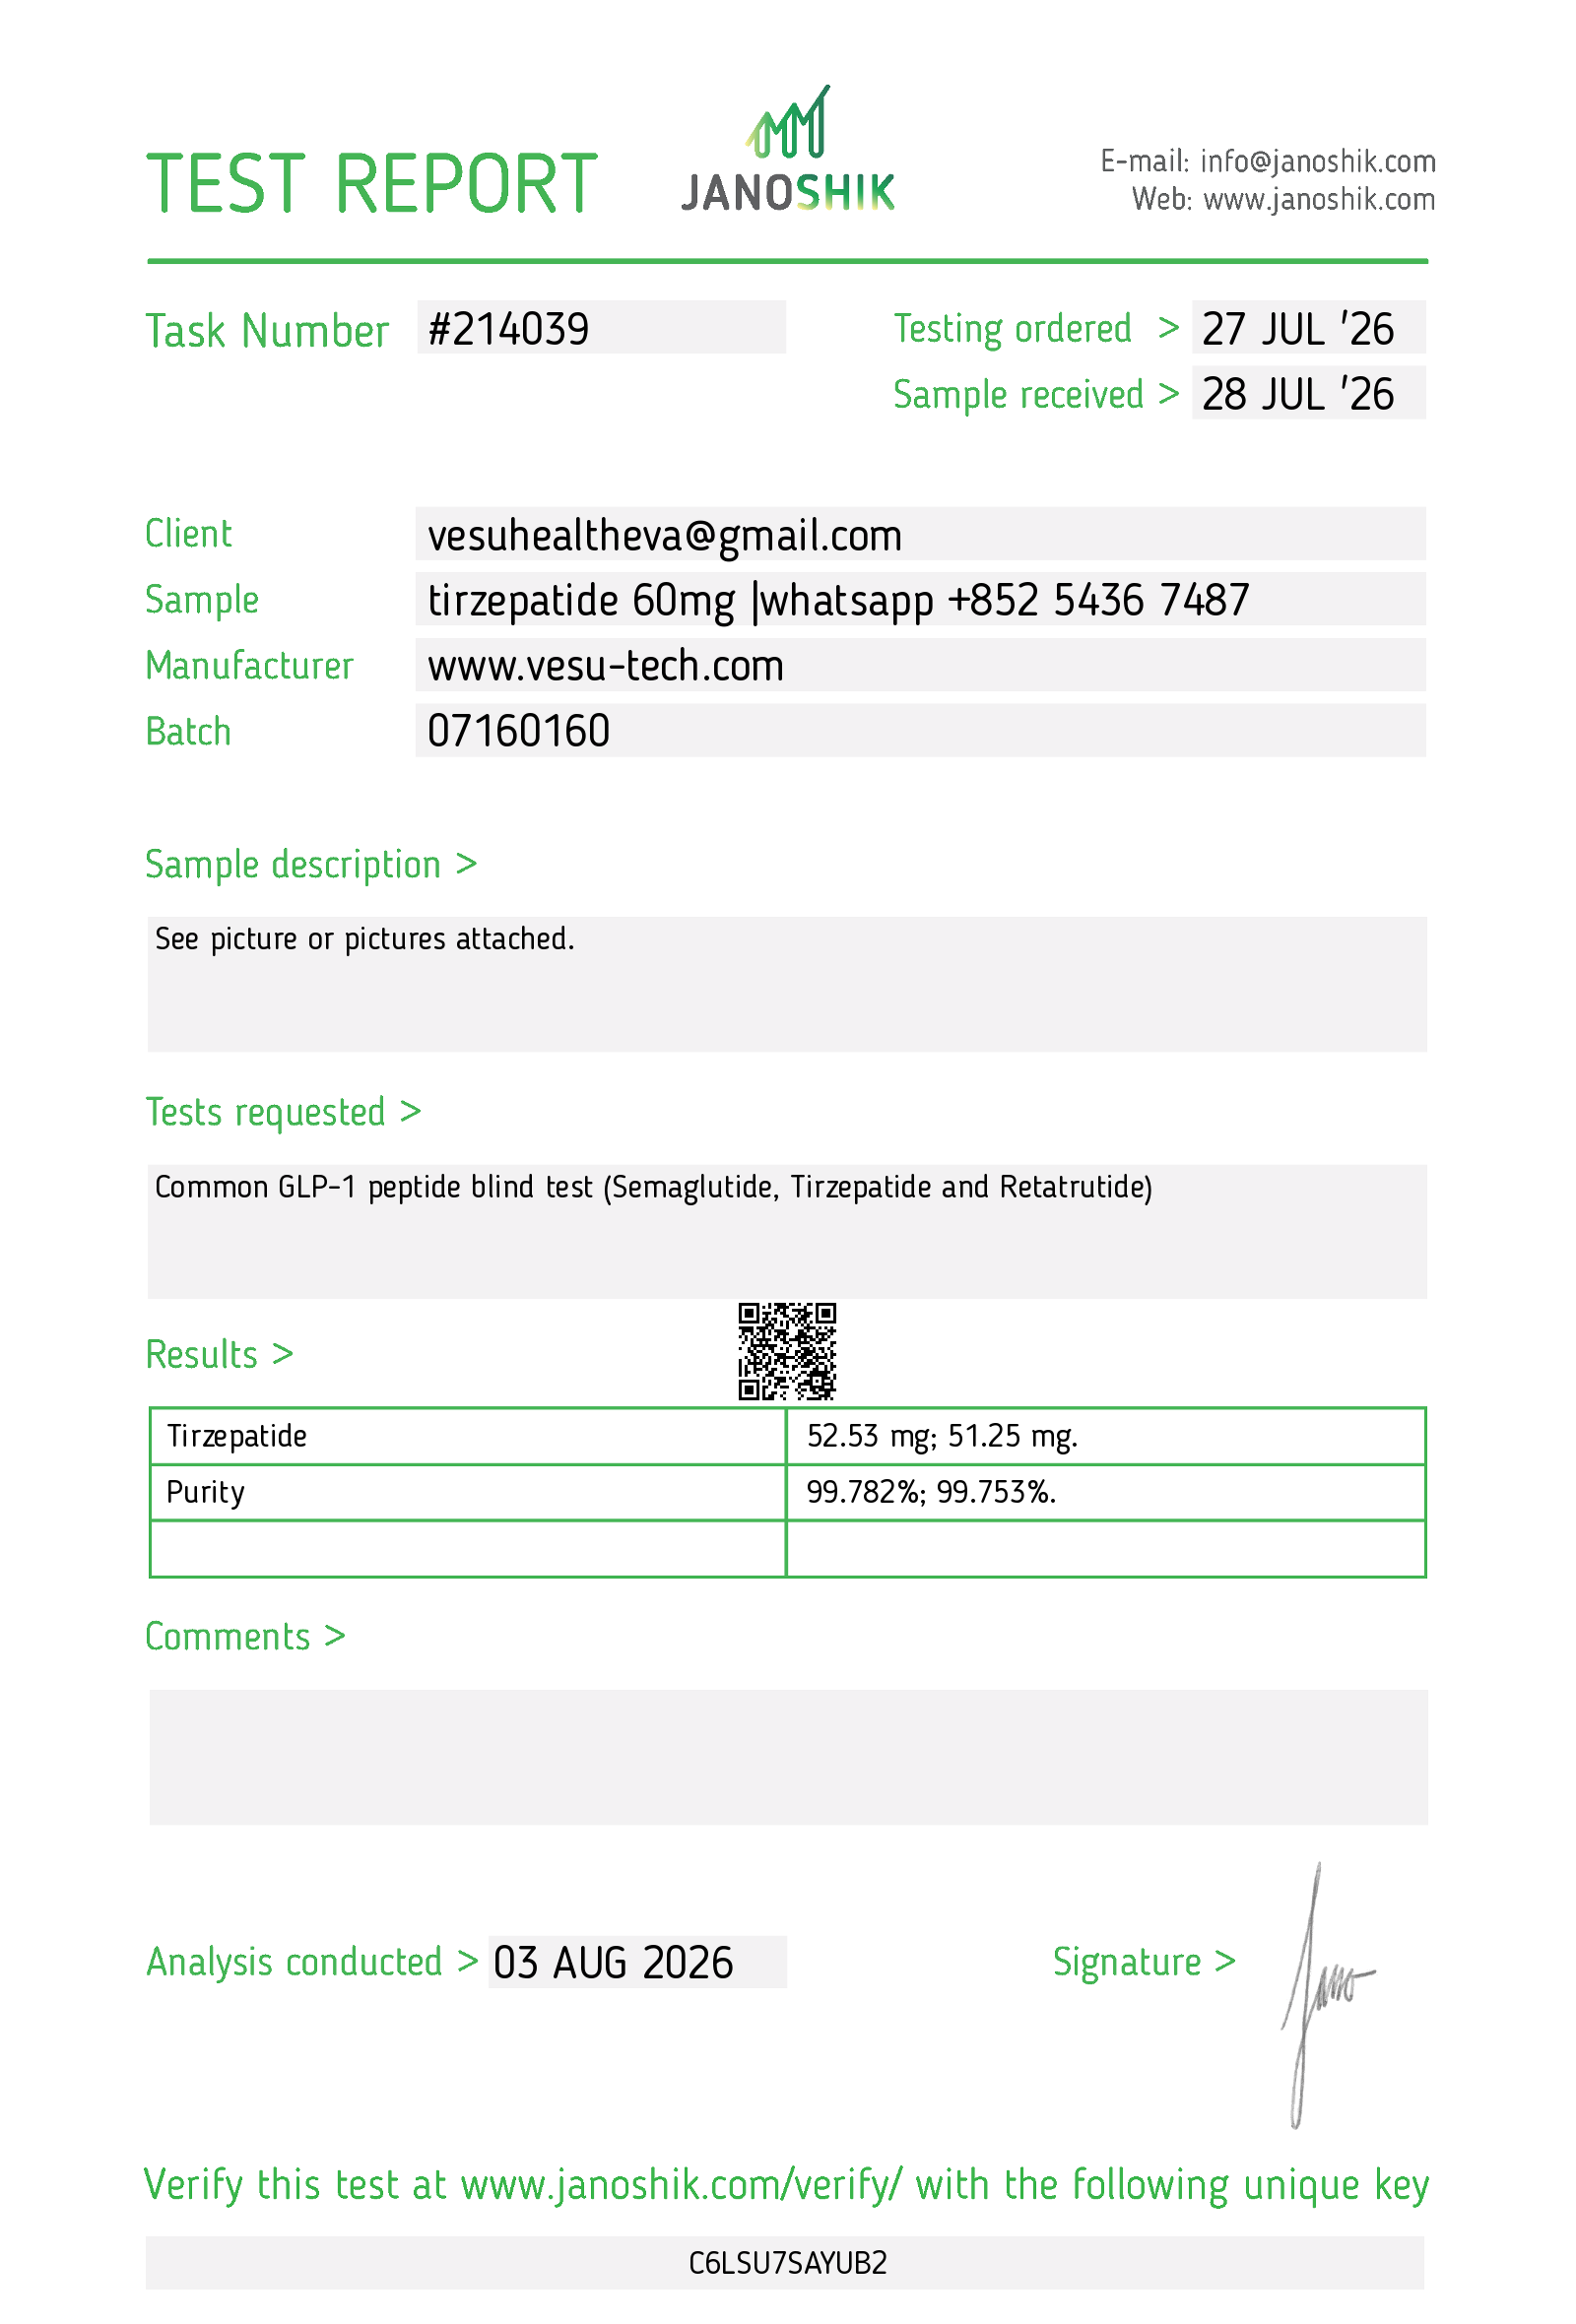
60mg labelled. 52.53mg and 51.25mg measured. Those readings were 12.45% and 14.58% short, despite purity results of 99.782% and 99.753%.
The purity result did not establish that the labelled amount was present.
Janoshik #214039 · August 3, 2026Select either image to enlarge the original, unchanged report. Checking #214039 also exposed a limit in our archive: the certificate contains two quantity readings, but its stored entry retains only the first. Other multi-sample certificates contribute multiple rows. Our percentages describe stored measurements, not every vial or every reading printed across the reports.
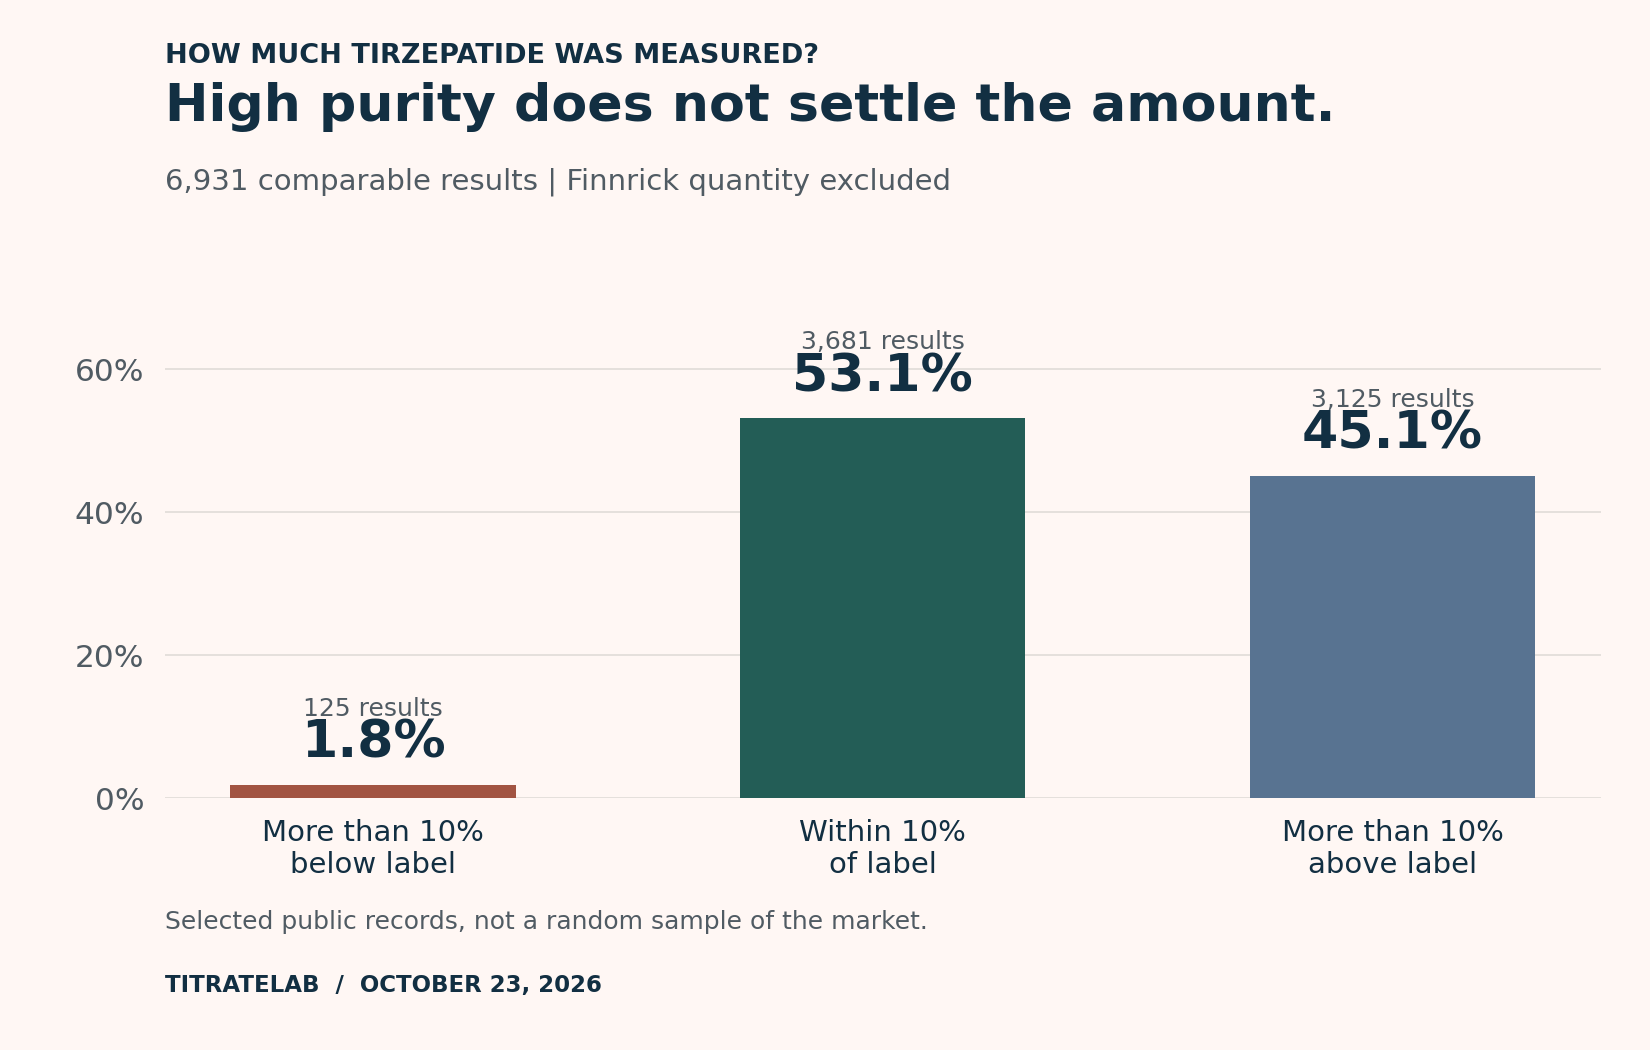
Shortfalls were uncommon. Excess material was not.
Across the comparable amount results, measurements more than 10% above the label outnumbered those more than 10% below it by 25 to one. These are measurements of vial contents, not records of doses administered to patients.
Measured amount vs label
6,931 comparable results
below
of label
above
TITRATELAB · OCTOBER 23, 2026
The median measured amount was about 9.0% above the label. Extra material can look like a bonus. For someone trying to establish whether a label is dependable, the variation still matters.
We limited the comparison to results with clear mass units, quantities that reconciled with the recorded deviation, and a usable test date. Records flagged for identity concerns or blends were excluded. So were Finnrick quantity records: we could not consistently establish that their reference amount was the amount printed on the vial.
Those exclusions matter. The 1.8% figure describes comparable records that survived the filters. It cannot tell us the chance that a randomly purchased vial will be short. Missing, ambiguous and extreme measurements do not become passes because they were left out.
One source also dominates the amount data. 5,240 of the 6,931 comparisons, or 75.6%, came through the Freedom Diagnostics feed. Remove that feed and 1,007 of the remaining 1,691 results, or 59.6%, fall within 10% of label, compared with 53.1% in the full eligible set. The composition of a public archive can change the apparent answer. We include both calculations in the downloads.
What the purity finding tells us
The median reported purity was 99.85% in the eligible positive results. That is a substantial favourable finding about the samples tested, and one worth including in a discussion often framed around unknown quality.
The percentage depends on what we counted. We excluded blends, explicitly unverified sources, invalid dates, zero or invalid purity values, and records with identity failures or concerns. Those records remain in the archive count. They are not part of the 11,105-result denominator, and 97.3% is not a pass rate for all 12,856 source records. The downloadable ledger records those decisions.
A 99% purity result also does not mean the vial contains 99% of the amount on its label. Purity, measured milligrams and contamination checks answer different questions. The services laboratories offer vary, as our comparison of testing methods explains.
What does the FDA actually say?
The FDA’s warning about illegally marketed online GLP-1 products covers several possibilities: the wrong ingredients, harmful ingredients, or too little, too much or no active ingredient. The agency also advises against research-labelled products sold to consumers for human use, citing unknown quality and possible harm. It does not put a market-wide failure percentage on those warnings.
The agency announced enforcement plans against mass-marketed compounded GLP-1s in February 2026 and issued warning letters about misleading telehealth marketing in March. Lilly separately calls for mass compounding of tirzepatide to stop, citing patient-safety risks. These are broader regulatory and safety questions than purity and measured content alone can answer.
Public laboratory reports let us examine some of those concerns. Others require evidence this analysis does not contain.
The high reported purity is encouraging within the selected subset. The variation in measured amounts supports taking the FDA’s amount concern seriously. Neither finding settles the other questions in the warning: this purity summary excludes flagged identity concerns and cannot rule out harmful contamination, establish sterility or prove equivalence to an approved medicine.
There is another limit to this comparison. We selected records by compound name; we did not independently classify every sample as a research vial, compounded prescription or approved medicine. The archive informs the grey-market debate, but it does not provide a head-to-head comparison of those supply channels. Nor can the FDA’s compounded-drug adverse-event figures be attached to these samples as an outcome rate.
Does the FDA allow a 10% margin of error?
Ten percent is our dividing line. It is not a universal allowance from the FDA. The agency’s out-of-specification guidance judges results against established specifications or acceptance criteria. Manufacturers justify product criteria for regulatory approval, as described in the FDA’s specifications guidance.
Our ±10% band makes the label discrepancies easier to compare. It does not establish FDA compliance or represent a laboratory’s measurement uncertainty. We could not verify a public numerical assay acceptance range for Mounjaro or Zepbound. Assigning either medicine a 90–110% requirement would go beyond what we established.
For a 10mg label, our band includes measurements from 9mg through 11mg. Below 9mg is more than 10% short; above 11mg is more than 10% over. Those categories describe the arithmetic, not regulatory approval or failure.
What would make a vial’s reliability easier to judge?
The laboratories, customers and sellers who publish these results have made scrutiny possible. A reader can check a favourable purity finding, notice a shortfall and return to the document behind either claim. That is a useful form of accountability.
The next question is whether the report describes the stock being sold. A batch number on a certificate helps only when the product can be linked to that batch. One tested sample cannot account for every vial in circulation.
Read the identified compound and measured milligrams, compare the amount with the label, and check the original report and batch details. Look separately for any contamination tests that were actually performed. Our COA verification guide explains those checks; Find Your Batch helps locate matching public records. None of these purity or amount findings establishes clinical effectiveness, sterility or equivalence to an approved medicine.
Method and downloads
Snapshot: October 23, 2026, 02:04 UTC. TitrateLab’s archive contained 119,392 published source records, including 20,277 labelled retatrutide and 12,856 labelled tirzepatide. We have already reviewed retatrutide’s testing record; this article examines tirzepatide. The archive includes other compounds and unresolved labels, not 119,392 separate peptide experiments.
We selected published archive rows with the exact stored compound name Tirzepatide. Flagged blends remain in that starting record count but are excluded from the purity and quantity summaries. Alternate compound labels are not added. The latest recorded tirzepatide test date was October 21. No beginning-of-period claim is made because some stored historical dates require review.
Shared report references produce 12,611 report groups. Consolidating matching duplicate result signatures leaves 12,851 retained result entries from 12,856 source rows; differing measurements remain separate. Neither rule proves independent samples, batches or physical tests. Some multi-sample reports are only partially represented by extracted measurements.
The purity calculation uses positive values at or below 100% after the exclusions described above. The amount calculation additionally requires explicit single mass values that reproduce the stored percentage deviation within 0.25 percentage points. It excludes Finnrick quantities, identity concerns, blends, explicitly unverified sources, missing or future dates, ambiguous amounts, and deviations at or below -99% or above +200%, which require separate review rather than inclusion in this comparison. These filters are quality checks on the analysis, not evidence that excluded products passed.
Public records are a nonrandom selection. Reporting decisions, repeated samples, laboratory methods and extraction limitations affect the results. We inspected the two archived report images shown above; automated access to Janoshik’s live verification pages was blocked during this review. We did not manually reread all 12,856 records. We make no market-wide failure-rate or improvement-over-time claim.
- Selected result ledger (CSV): public record links, retained measurements and eligibility decisions.
- Snapshot and denominators (JSON).
- Recalculate the article’s statistics (Python).
- Explore the current tirzepatide research page. Its broader live figures use a different population and change as the archive updates.
Prepared by TitrateLab with AI-assisted analysis and drafting, reviewed October 23, 2026. TitrateLab did not perform the laboratory tests. For methodology and corrections, see how we handle evidence.