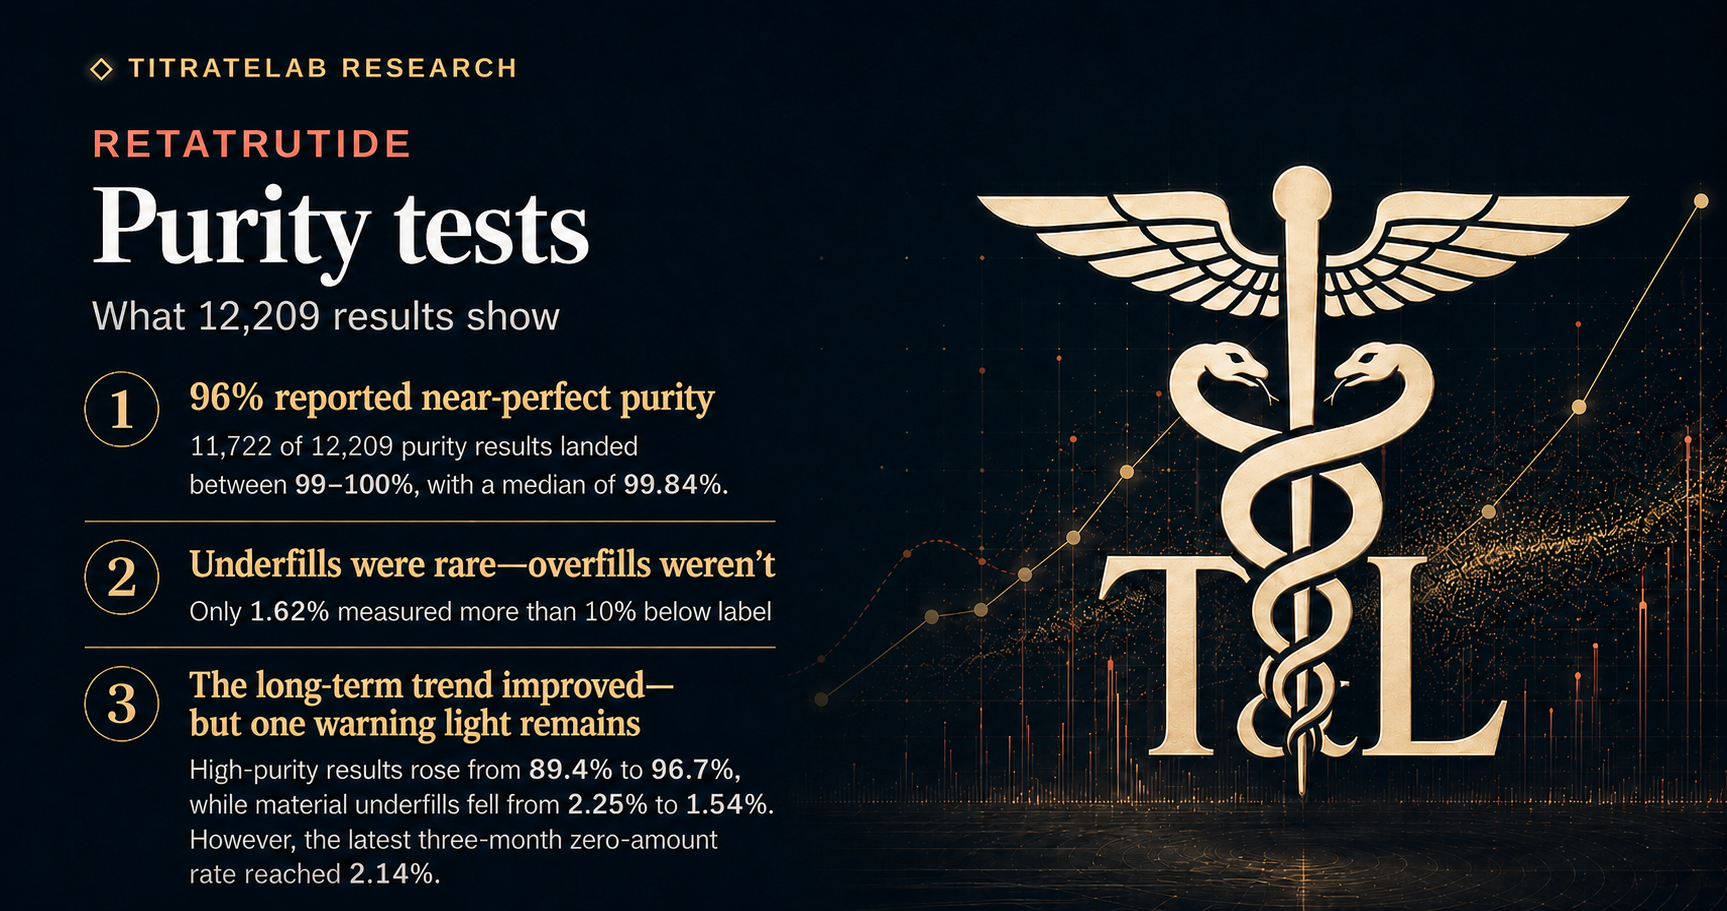
What 12,870 retatrutide COAs show
TitrateLab’s August 15 review covers 12,870 public retatrutide certificates. Of those, 656 reported neither purity nor label deviation. Among 12,209 records reporting purity, 11,722 (96.0%) fell between 99% and 100%; the median was 99.84%.
The distribution was not uniformly favorable. 164 of 10,853 amount results (1.51%) measured 0 mg of retatrutide, all from Finnrick. Those source records also carry purity as 0%, but the relevant finding here is zero measured amount—not a conventional purity percentage.
Here, a low amount means the laboratory measured less than 90% of the amount stated on the label—more than 10% below the label claim. These are measured peptide amounts, not the vial’s visual fill level. Finnrick is excluded from this comparison because its reference amount may be a submitted batch claim rather than necessarily the vial label. Of 7,241 label-comparable tests, 117 (1.62%) met the threshold: the lowest observed rate among 26 compounds meeting the stated minimum counts. The separate 0 mg count can include Finnrick because it does not require a label comparison.
The latest results are encouraging—but the mix changed
On the headline measures, the latest 12-month window looks better. Reported purity between 99% and 100% rose from 89.4% to 96.7%; label-comparable amount results below 90% of label declined from 2.25% to 1.54%; and 0 mg amount results declined from 2.57% to 1.42%. That is encouraging—not proof of market-wide manufacturing improvement.
Several large sources moved in the same direction. At Freedom Diagnostic, reported purity at 99–100% rose from 97.6% to 99.3%, while results below 90% of label declined from 3.85% to 1.46%. The high-purity share also rose at Finnrick (82.3% to 90.3%) and Janoshik Public (96.1% to 99.7%). Janoshik’s below-label rate, however, rose from 2.21% to 2.61%.
Testing visibility expanded: TitrateLab captured 11,541 dated reports from 15 source channels in the latest window, versus 1,151 from 11 previously. More public evidence is available, and key metrics moved in the right direction. This does not establish a tenfold rise in market testing or prove that industry-wide manufacturing standards improved.
The shorter-period pattern is more nuanced. Across eight consecutive three-month blocks, the share of amount results below 90% of label peaked at 3.96% and ended at 1.26% (44 of 3,505 tests). Non-zero purity below 97% ended at 0.68% (31 of 4,549). The 0 mg amount series is the caution: it rose from 1.07% to 2.14% (88 of 4,114 amount results) in the latest block. The longer-window direction is encouraging, but the newest zero-amount signal did not improve.
Three adverse testing signals over time
This means the lab measured more than 10% less peptide than the label states. Latest period: 44 of 3,505 non-Finnrick tests with a label-comparable amount result.
The laboratory reported 0 mg of retatrutide against a positive reference amount. Latest period: 88 of 4,114 reports with an amount result.
Latest period: 31 of 4,549 reported results were non-zero and below 97% purity.
Purity and amount answer different questions
Only 44.23% of label-comparable amount tests landed within ±10% of label. Another 1.62% were more than 10% below label, while 54.15% were more than 10% above it.
Results above label are still departures, not evidence of precision or a benefit. Purity describes relative composition; amount testing asks how much identified compound was measured. Identity, endotoxin and sterility are separate questions.
How often are compounded batches tested?
Not every compounded batch is required to receive the same tests. Traditional 503A pharmacies can qualify for exemption from federal current good manufacturing practice requirements, and state rules vary. USP General Chapter 797 identifies intended-strength variability exceeding 10% for nonofficial compounded sterile preparations as a risk, but it does not create a universal finished-product potency-assay requirement for every 503A batch.
Sterility testing also depends on how the preparation is categorized and its beyond-use date. It is not required for Category 1 preparations; Category 2 preparations require it only when assigned a beyond-use date that calls for testing; and Category 3 preparations require batch sterility testing. Even then, laboratories test samples—not every vial. For batches of 1–39 preparations, USP’s testing FAQ specifies a sample equal to 10% of the batch, rounded up.
FDA-registered 503B outsourcing facilities face a stricter standard: each batch must receive an appropriate laboratory determination showing conformity with release specifications, including identity and strength. That still means a documented sampling plan, not testing every finished vial.
The testing gap has produced measurable failures. In a limited 2001 survey of products ordered from 12 internet compounding pharmacies, FDA found that 10 of 29 sampled products failed at least one quality test. Nine failed potency testing and contained 59–89% of the expected amount. More recently, FDA said Boothwyn Pharmacy released and distributed semaglutide at 79.876% potency and tirzepatide at 86.779% and 89.13%; another tirzepatide combination lot failed sterility testing, and FDA said potency testing appeared selective rather than every-lot.
The 2001 survey was small, risk-selected and not GLP-1-specific, while Boothwyn is one enforcement case. Neither estimates the failure rate of all compounded products or supplies an apples-to-apples comparison with this voluntary retatrutide corpus.
These COAs are voluntary, nonrandom submissions. A report measures one submitted sample, not every vial in a batch. High reported purity does not prove sterility, endotoxin control, clinical safety or pharmaceutical manufacturing standards.
What this corpus can—and cannot—support
The three largest sources—Freedom Diagnostic, Finnrick and Janoshik Public—accounted for 12,332 of 12,870 certificates (95.8%). This concentration and voluntary submission limit generalization.
The defensible conclusion is narrow: reported purity clustered at 99–100%, while the non-Finnrick amount subset had the lowest observed below-90%-of-label rate among the 26 compounds meeting the thresholds. The corpus also contains 164 amount results measured at 0 mg, substantial overfill and no basis for a market-wide safety or quality conclusion.
Method and live data
We queried published Retatrutide records in TitrateLab’s COA database on August 15, 2026, using a 05:22:39 UTC discovery cutoff. Purity statistics use records with a reported purity result. Label-comparable amount statistics exclude Finnrick because its reference may be a submitted batch claim rather than the vial label. The 0 mg metric includes Finnrick because it uses measured amount without calculating a label-relative percentage. Dated trends cover August 15, 2024 through August 14, 2026.
This is a living corpus. The live retatrutide evidence hub and retatrutide COA archive will show newer totals and may apply page-specific eligibility filters; that does not change the reviewed denominators reported here. See TitrateLab’s methodology for attribution and normalization rules, or review the broader analysis of 64,787 checkable grey-market peptide lab records. To flag a source or calculation error, email [email protected]; material corrections will be recorded on this page.
Quick answers
What do retatrutide purity tests show?
In the August 15 review, 11,722 of 12,209 reported retatrutide purity results (96.0%) were between 99% and 100%, and the median was 99.84%. Separately, 164 of 10,853 amount results (1.51%) measured 0 mg. These figures describe submitted records, not market-wide quality.
Does a high-purity retatrutide COA prove a vial is safe?
No. A purity result supports what one laboratory measured in one submitted sample. It does not establish sterility, endotoxin control, batch-wide consistency, clinical safety or suitability for human use.