How much did Medicare spend on Ozempic and Mounjaro in 2024?
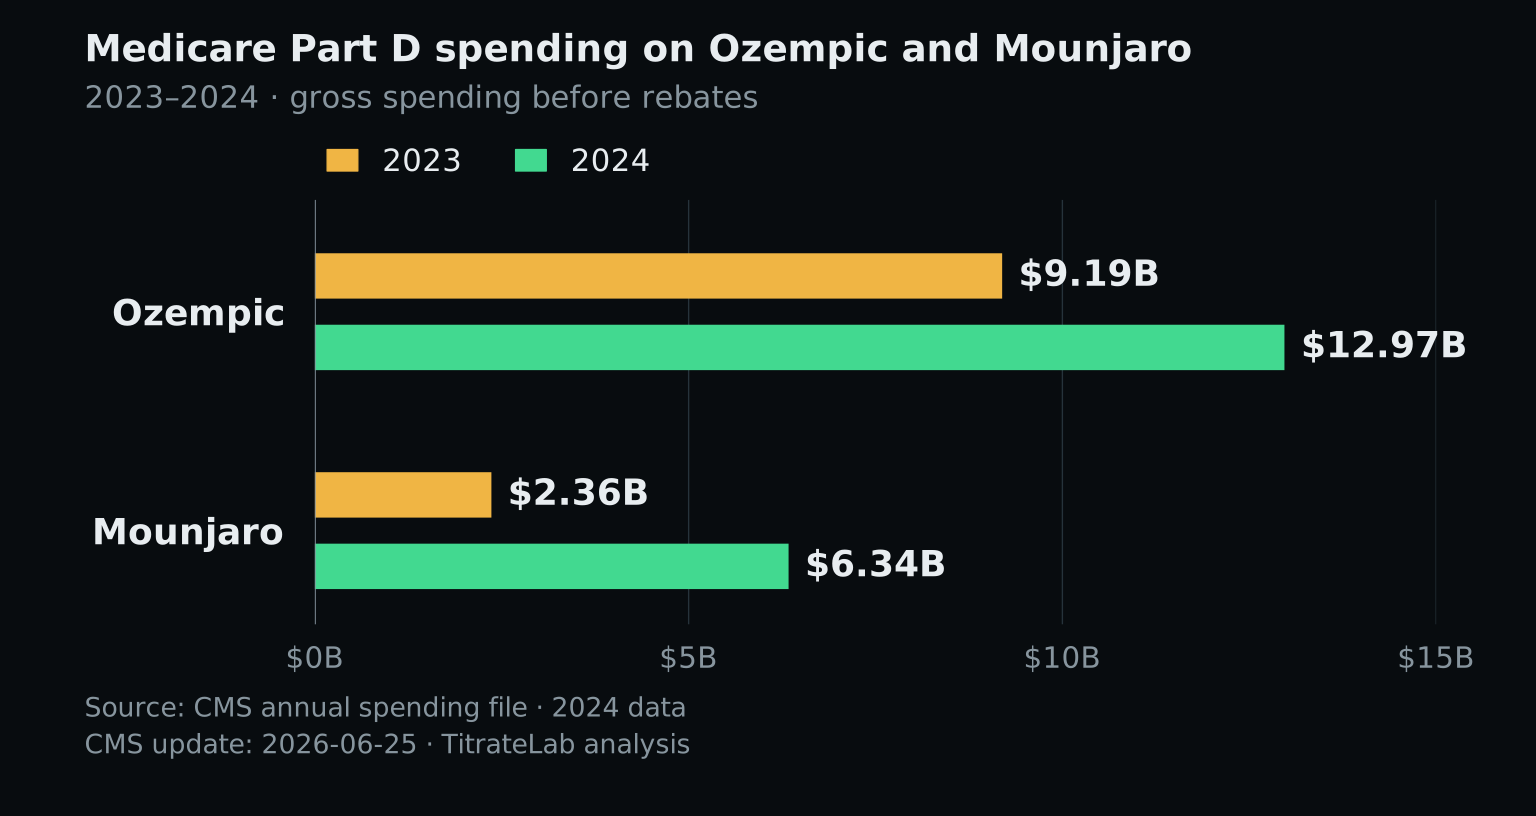
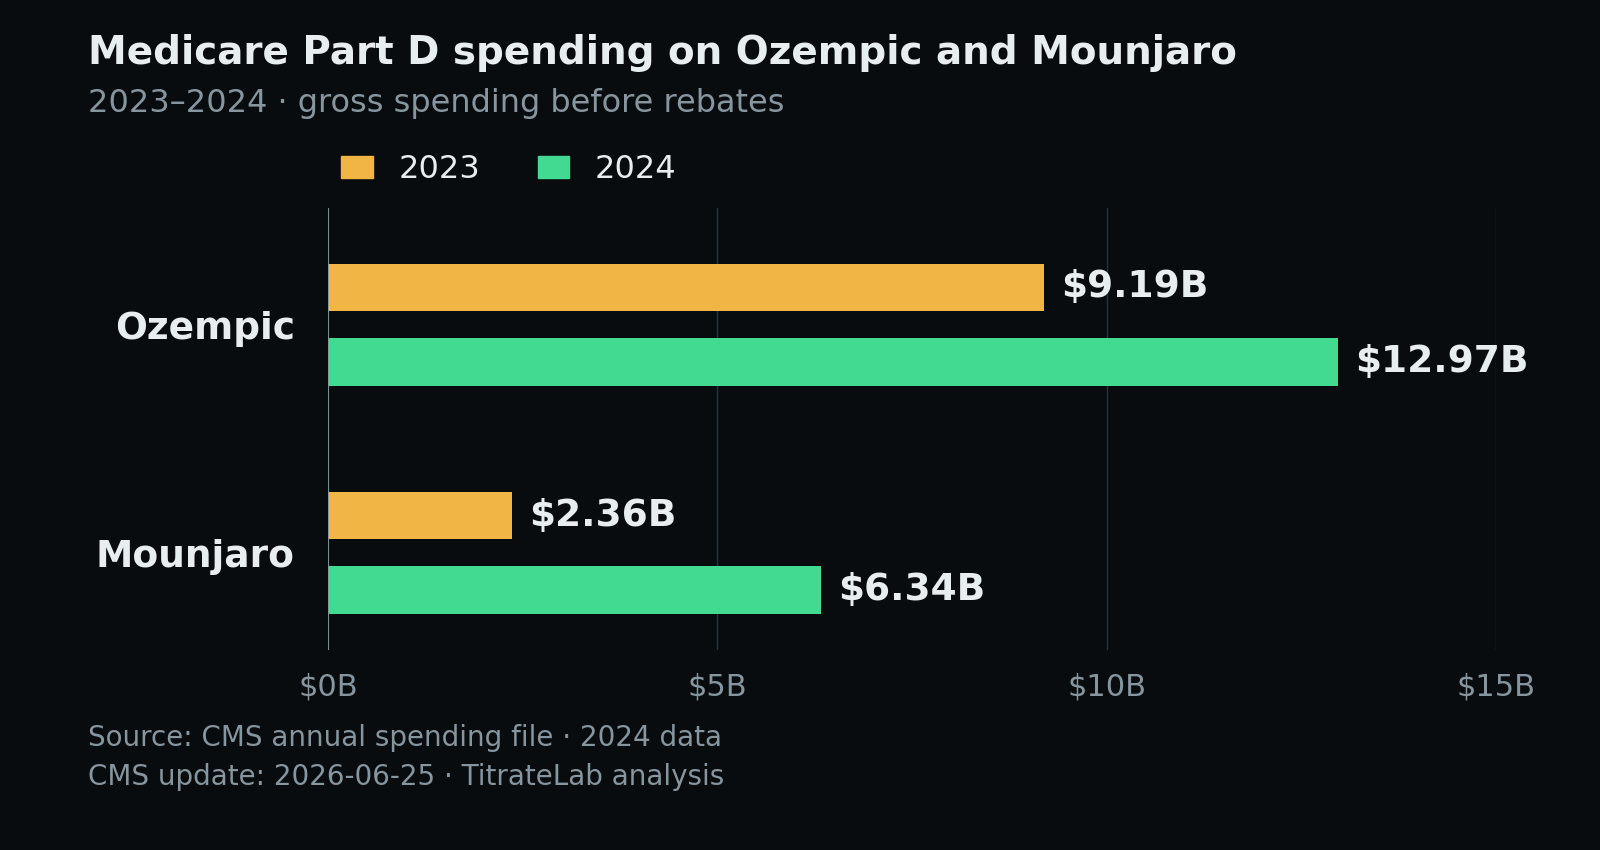
CMS’s 2024 annual file places Ozempic second and Mounjaro fourth among all Medicare Part D drug entries by total spending. Ozempic contains semaglutide; Mounjaro contains tirzepatide. Their combined total was $19,307,238,987.70. The file carries a June 25, 2026 update date. Source: CMS Part D data
These are calendar-year prescription costs, including Medicare, plan and beneficiary payments, before manufacturer rebates and other price concessions. They are not patients’ out-of-pocket costs or the government’s net bill. The amounts cover each product’s recorded uses; this analysis does not isolate weight-loss treatment. CMS definition
| Product | Ingredient | 2023 Part D spending | 2024 Part D spending | 2024 rank |
|---|---|---|---|---|
| Ozempic | Semaglutide | $9.19 billion | $12.97 billion | 2 |
| Mounjaro | Tirzepatide | $2.36 billion | $6.34 billion | 4 |
Amounts are rounded here; the downloadable calculations retain exact dollars, ranks, program names, source URLs and file hashes.
Top five drugs by Medicare Part D and Medicaid spending in 2024
The same sorting method produces the following top five in each program. Rankings use CMS’s individual drug entries across all manufacturers; they do not combine every brand or formulation containing the same ingredient. CMS Part D · CMS Medicaid
| Rank | Medicare Part D drug | 2024 spending | Medicaid drug | 2024 spending |
|---|---|---|---|---|
| 1 | Eliquis | $20.77 billion | Humira(CF) Pen | $3.45 billion |
| 2 | Ozempic | $12.97 billion | Ozempic | $3.41 billion |
| 3 | Jardiance | $11.44 billion | Biktarvy | $3.22 billion |
| 4 | Mounjaro | $6.34 billion | Jardiance | $2.24 billion |
| 5 | Xarelto | $6.23 billion | Trulicity | $2.17 billion |
Mounjaro’s absence from Medicaid’s top five does not mean Medicaid did not cover it: its entry ranked 14th, at $993.03 million. Humira(CF) Pen is one CMS entry, not all Humira formulations. Medicaid totals include reimbursement by Medicaid and non-Medicaid entities and are not reduced by Medicaid rebates. CMS Medicaid data and definition
Medicare Part B, which covers many drugs administered in outpatient settings, is a separate file. Its highest individual 2024 entry was Keytruda at $5.99 billion. That file excludes Medicare Advantage; we have not merged Part B and Part D into an all-Medicare, ingredient-level ranking. CMS Part B data and methodology
What public semaglutide and tirzepatide lab records show
Prescription spending describes a different population from the research-market laboratory records indexed by TitrateLab. A Medicare claim cannot be linked to a TitrateLab sample by matching its ingredient name. The spending files provide no denominator for the proportion of research-market products tested.
For a separate evidence check, we captured TitrateLab’s two public compound pages on September 8, 2026, at 03:48 UTC. The figures below describe what those pages exposed at that time. They are observations of published records, not a representative survey of the market. Semaglutide page · Tirzepatide page
| Public-page measure | Semaglutide | Tirzepatide |
|---|---|---|
| Population used by the page | 1,087 numeric COA source records, without deduplication | 10,916 results, after consolidating matching duplicate result signatures from 10,921 source records |
| Report groups | Not supplied on the captured page | 10,676 groups; not unique physical batches |
| Latest test date displayed | August 18, 2026 | September 6, 2026 |
| Amount data counted by the page | 832 source records with a recorded amount-deviation value | 6,387 results eligible for comparable label-amount analysis |
| Classifiable endotoxin results | 18 of 1,087 source records | 572 of 10,916 results |
The columns are not directly comparable quality measures. Semaglutide’s page starts from numeric source records and does not deduplicate them. Tirzepatide’s page includes published results under a newer consolidation method. Record counts, result counts, report groups and physical batches are different units; none should silently become another.
The amount denominators also differ: tirzepatide excludes batch-claim comparisons and other ineligible results; the semaglutide count does not apply that same eligibility filter.
The latest displayed test date also does not measure how quickly TitrateLab discovered or processed a report. Both pages showed calculations made on September 8, but their underlying test dates extend back to 2022. The coverage download preserves those dates, the separate counting rules and unavailable fields.
Missing endotoxin information is an evidence gap, not a failed test
Within each page’s own population, classifiable endotoxin evidence appeared for 18 of 1,087 semaglutide source records, about 1.7%, and 572 of 10,916 tirzepatide results, about 5.2%. These percentages describe the availability of a determinate result in the captured page, not an endotoxin pass rate. Public semaglutide evidence · Public tirzepatide evidence
For tirzepatide, the remaining 10,344 results were separated into 10,295 with endotoxin information not reported, 42 with a reported entry but no classifiable verdict, and seven borderline entries. Semaglutide’s public page did not expose the same breakdown. The absence of a classifiable result can reflect a missing test, an unavailable document, or information that was not extracted; this audit cannot distinguish those possibilities.
A large purity dataset therefore does not establish that other questions have been answered. Readers should inspect the original report for the sample identifier, laboratory, test date, methods and specific results. A record linked to one sample also does not establish the condition of every item sold under the same compound or vendor name.
Inspect public lab evidence or find a batch record
For an overview, open the semaglutide evidence summary or the tirzepatide evidence summary. The aggregate pages are public; their original-report archives are presented as a Pro feature. TitrateLab has a commercial interest in subscriptions, and these public-page measurements do not constitute an independent audit of its complete database.
If you already have a printed batch identifier, use Find Your Batch for semaglutide or Find Your Batch for tirzepatide. A search returns candidate records to inspect. A matching code alone does not establish that two samples came from the same physical lot; no match means no matching record was returned by that search.
Neither a spending figure nor a certificate establishes that a research product is clinically equivalent to an approved medicine. The FDA explains that unapproved GLP-1 products have not undergone its review for safety, effectiveness and quality. This report does not recommend a treatment or a purchasing substitute. FDA explanation
CMS sources, ranking method and evidence limits
CMS calculation. We used the annual 2024 Part D, Medicaid and Part B CSVs listed in the CMS catalog with a June 25, 2026 update date. Part D contained 14,536 rows, of which 3,625 were all-manufacturer drug entries; Medicaid contained 18,511 rows, of which 4,774 were all-manufacturer entries. Filtering to those overall rows avoids counting manufacturer subtotals twice. We sorted the 2024 spending values numerically in descending order, retained CMS’s product groupings, and used the same file’s 2023 fields for the trend. Missing or suppressed values were retained as unavailable, never invented as zero. Part B’s 799 billing-code entries were checked separately.
Public-page calculation. We fetched the two compound pages without an account, retained their public aggregate facts and method explanations, and recorded capture times and response hashes. We did not query a production database, obtain gated reports, or count private community material. Fields not available from the captured page remain unavailable. This checks the public presentation; it does not independently validate every underlying laboratory result, sample identity or extraction.
Downloads. CMS calculations, CSV · Public evidence coverage, CSV · Sources and provenance, JSON · Spending chart, SVG
Prepared by the TitrateLab Research Desk with AI-assisted extraction, calculation and drafting. The calculations were checked against the downloaded source files; no independent clinical or laboratory review is claimed. Evidence reviewed September 8, 2026. Public-page figures may change after that date. For a correction, identify the figure and source through the contact route on our methodology page.