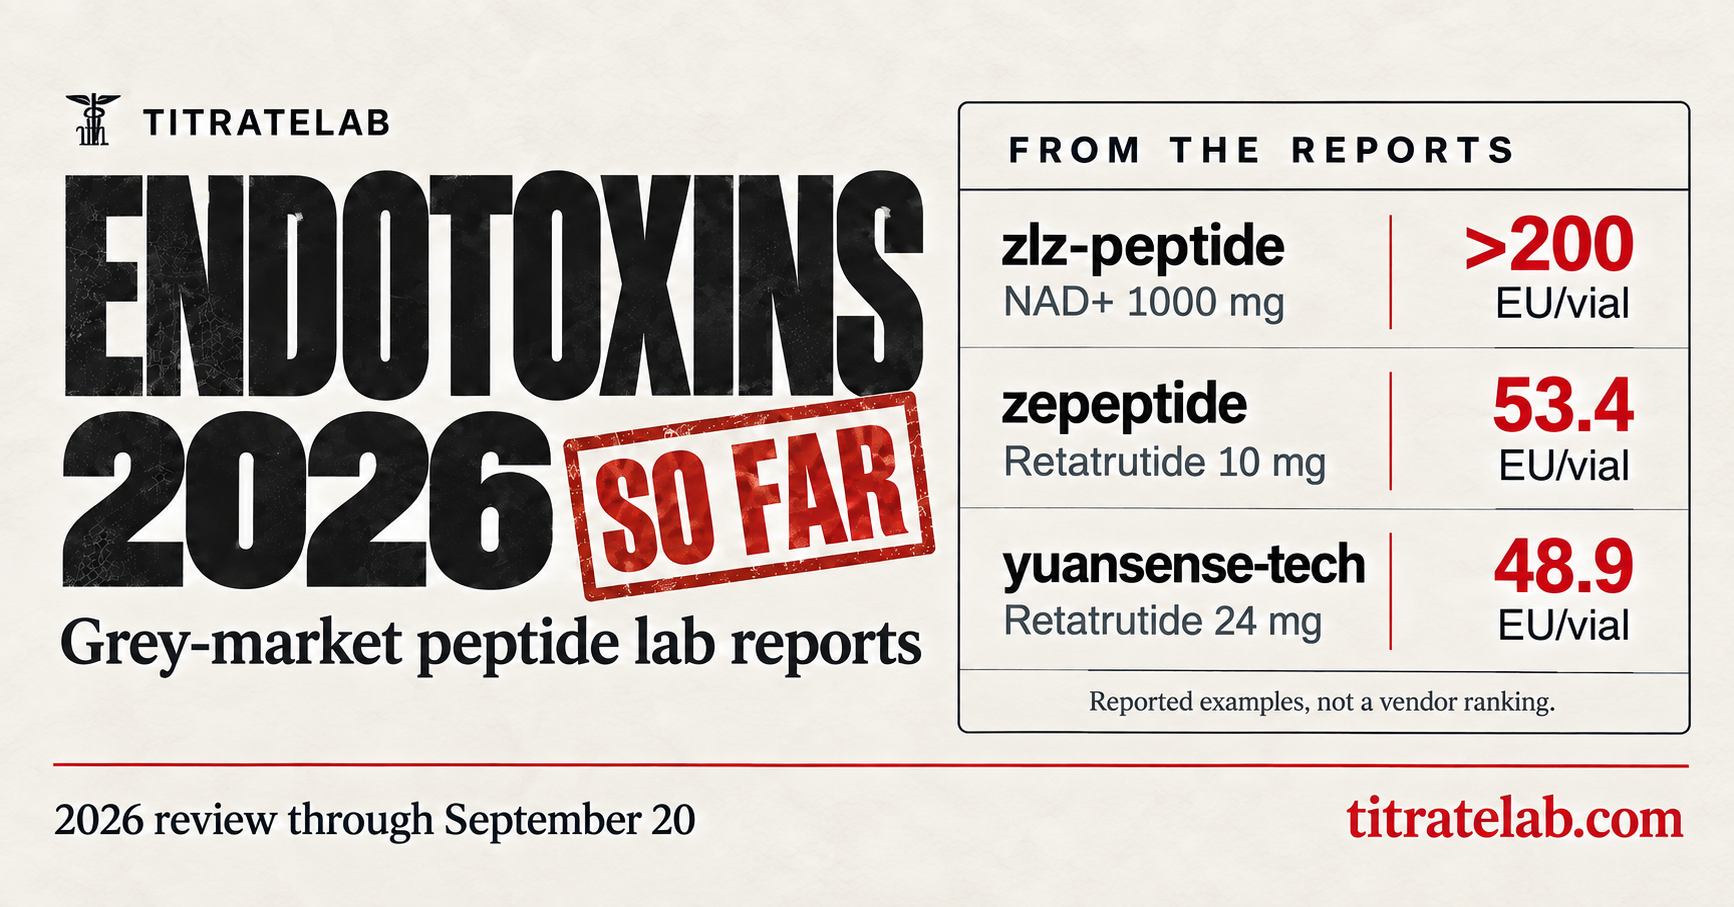
Endotoxins in 2026 so far
TitrateLab’s September 20 snapshot contains 106,942 published lab-report entries across test types. Within the January 1 to September 20, 2026 records, we found 55 adverse endotoxin labels and 18 borderline labels. Those labels led us back to the certificates, where we found false detection labels, omitted measurements and duplicates. These are not verified counts of contaminated batches.
What the numbers mean: EU stands for endotoxin units, a measure of the activity of bacterial material that can trigger inflammation. EU per vial describes the reported total in the vial. It does not describe the amount someone necessarily receives. In 14 selected exact per-vial examples, the median was 48.9 EU and the mean was 92.5 EU. Neither is a market-wide estimate.
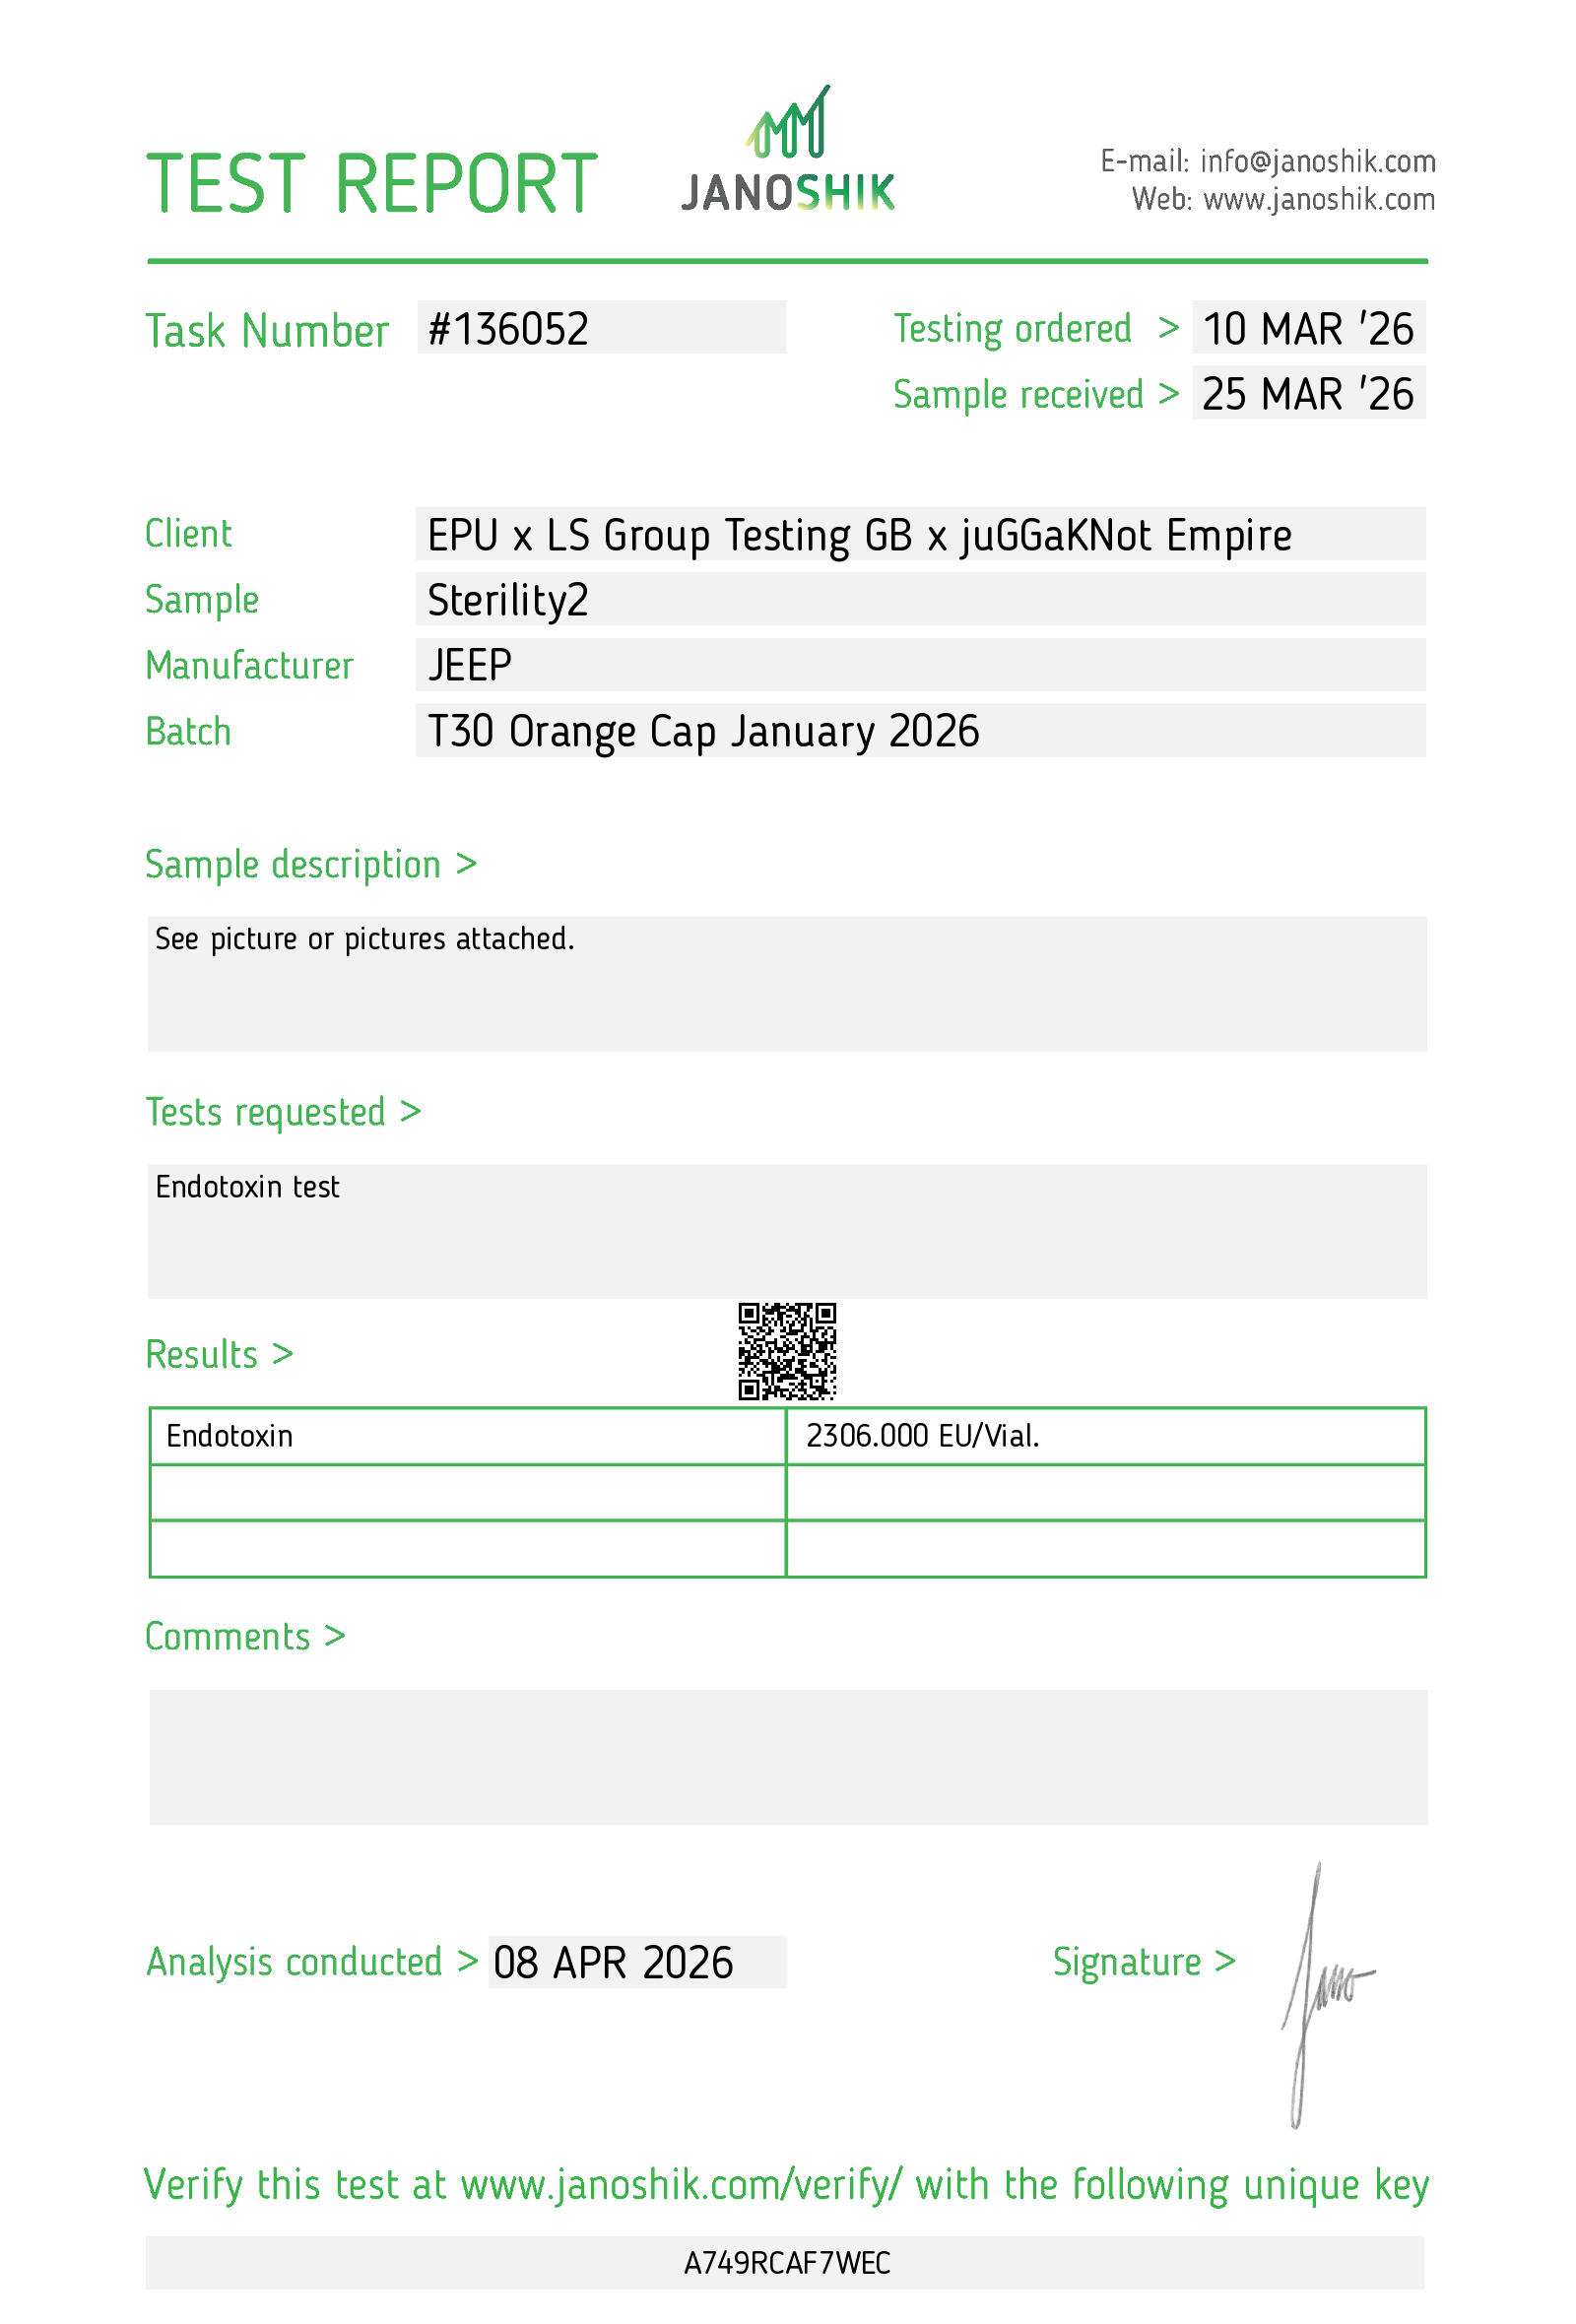
What could be concerning: A source-checked report recorded 2,306 EU per vial. One fifth of that total is 461.2 EU, assuming even distribution. For context, a common pharmaceutical acceptance benchmark is 350 EU within one hour for a 70 kg adult. It is not a personal safety threshold, but it shows why a whole vial is not always needed to exceed the benchmark. FDA’s explanation.
What changed since 2025: Adverse labels rose from 4 to 55 for the same calendar dates. But the pass-or-adverse records grew from 388 to 6,196, leaving the labeled share at 1.03% versus 0.89%. Changing coverage and errors prevent a conclusion about the market’s contamination rate.
Where the flags cluster: JEEP, GYC and Uther lead the named flag counts. Retatrutide and tirzepatide each have 14 adverse labels; NAD+ has 11. These are leads for investigation, not vendor failure-rate rankings.
What filtering can change: Some specialized filters remove endotoxin under tested conditions. A generic sterile syringe filter has no dependable removal percentage for peptide solutions. The review below explains the measurements, the source discrepancies and why a blanket 70% filtering allowance is unsupported.
What the source certificates actually say
A confirmed high measurement: JEEP, Janoshik report 136052, dated April 8, reports 2,306 EU/vial for batch T30 Orange Cap January 2026. Its numeric-only database entry was omitted by the status counter, although a community entry refers to the same certificate. FSD report 167470 records 536.652 EU/vial and was also omitted because its status field was blank.
Have a report of your own? Find available COAs by compound and batch number. Our COA verification guide explains how to check the source and test scope.
A false detection label: Evolve Peptides’ Selank certificate says <50 EU/vial, Conforms. That is an upper bound, not proof of a positive finding. Our database nevertheless labels it detected.
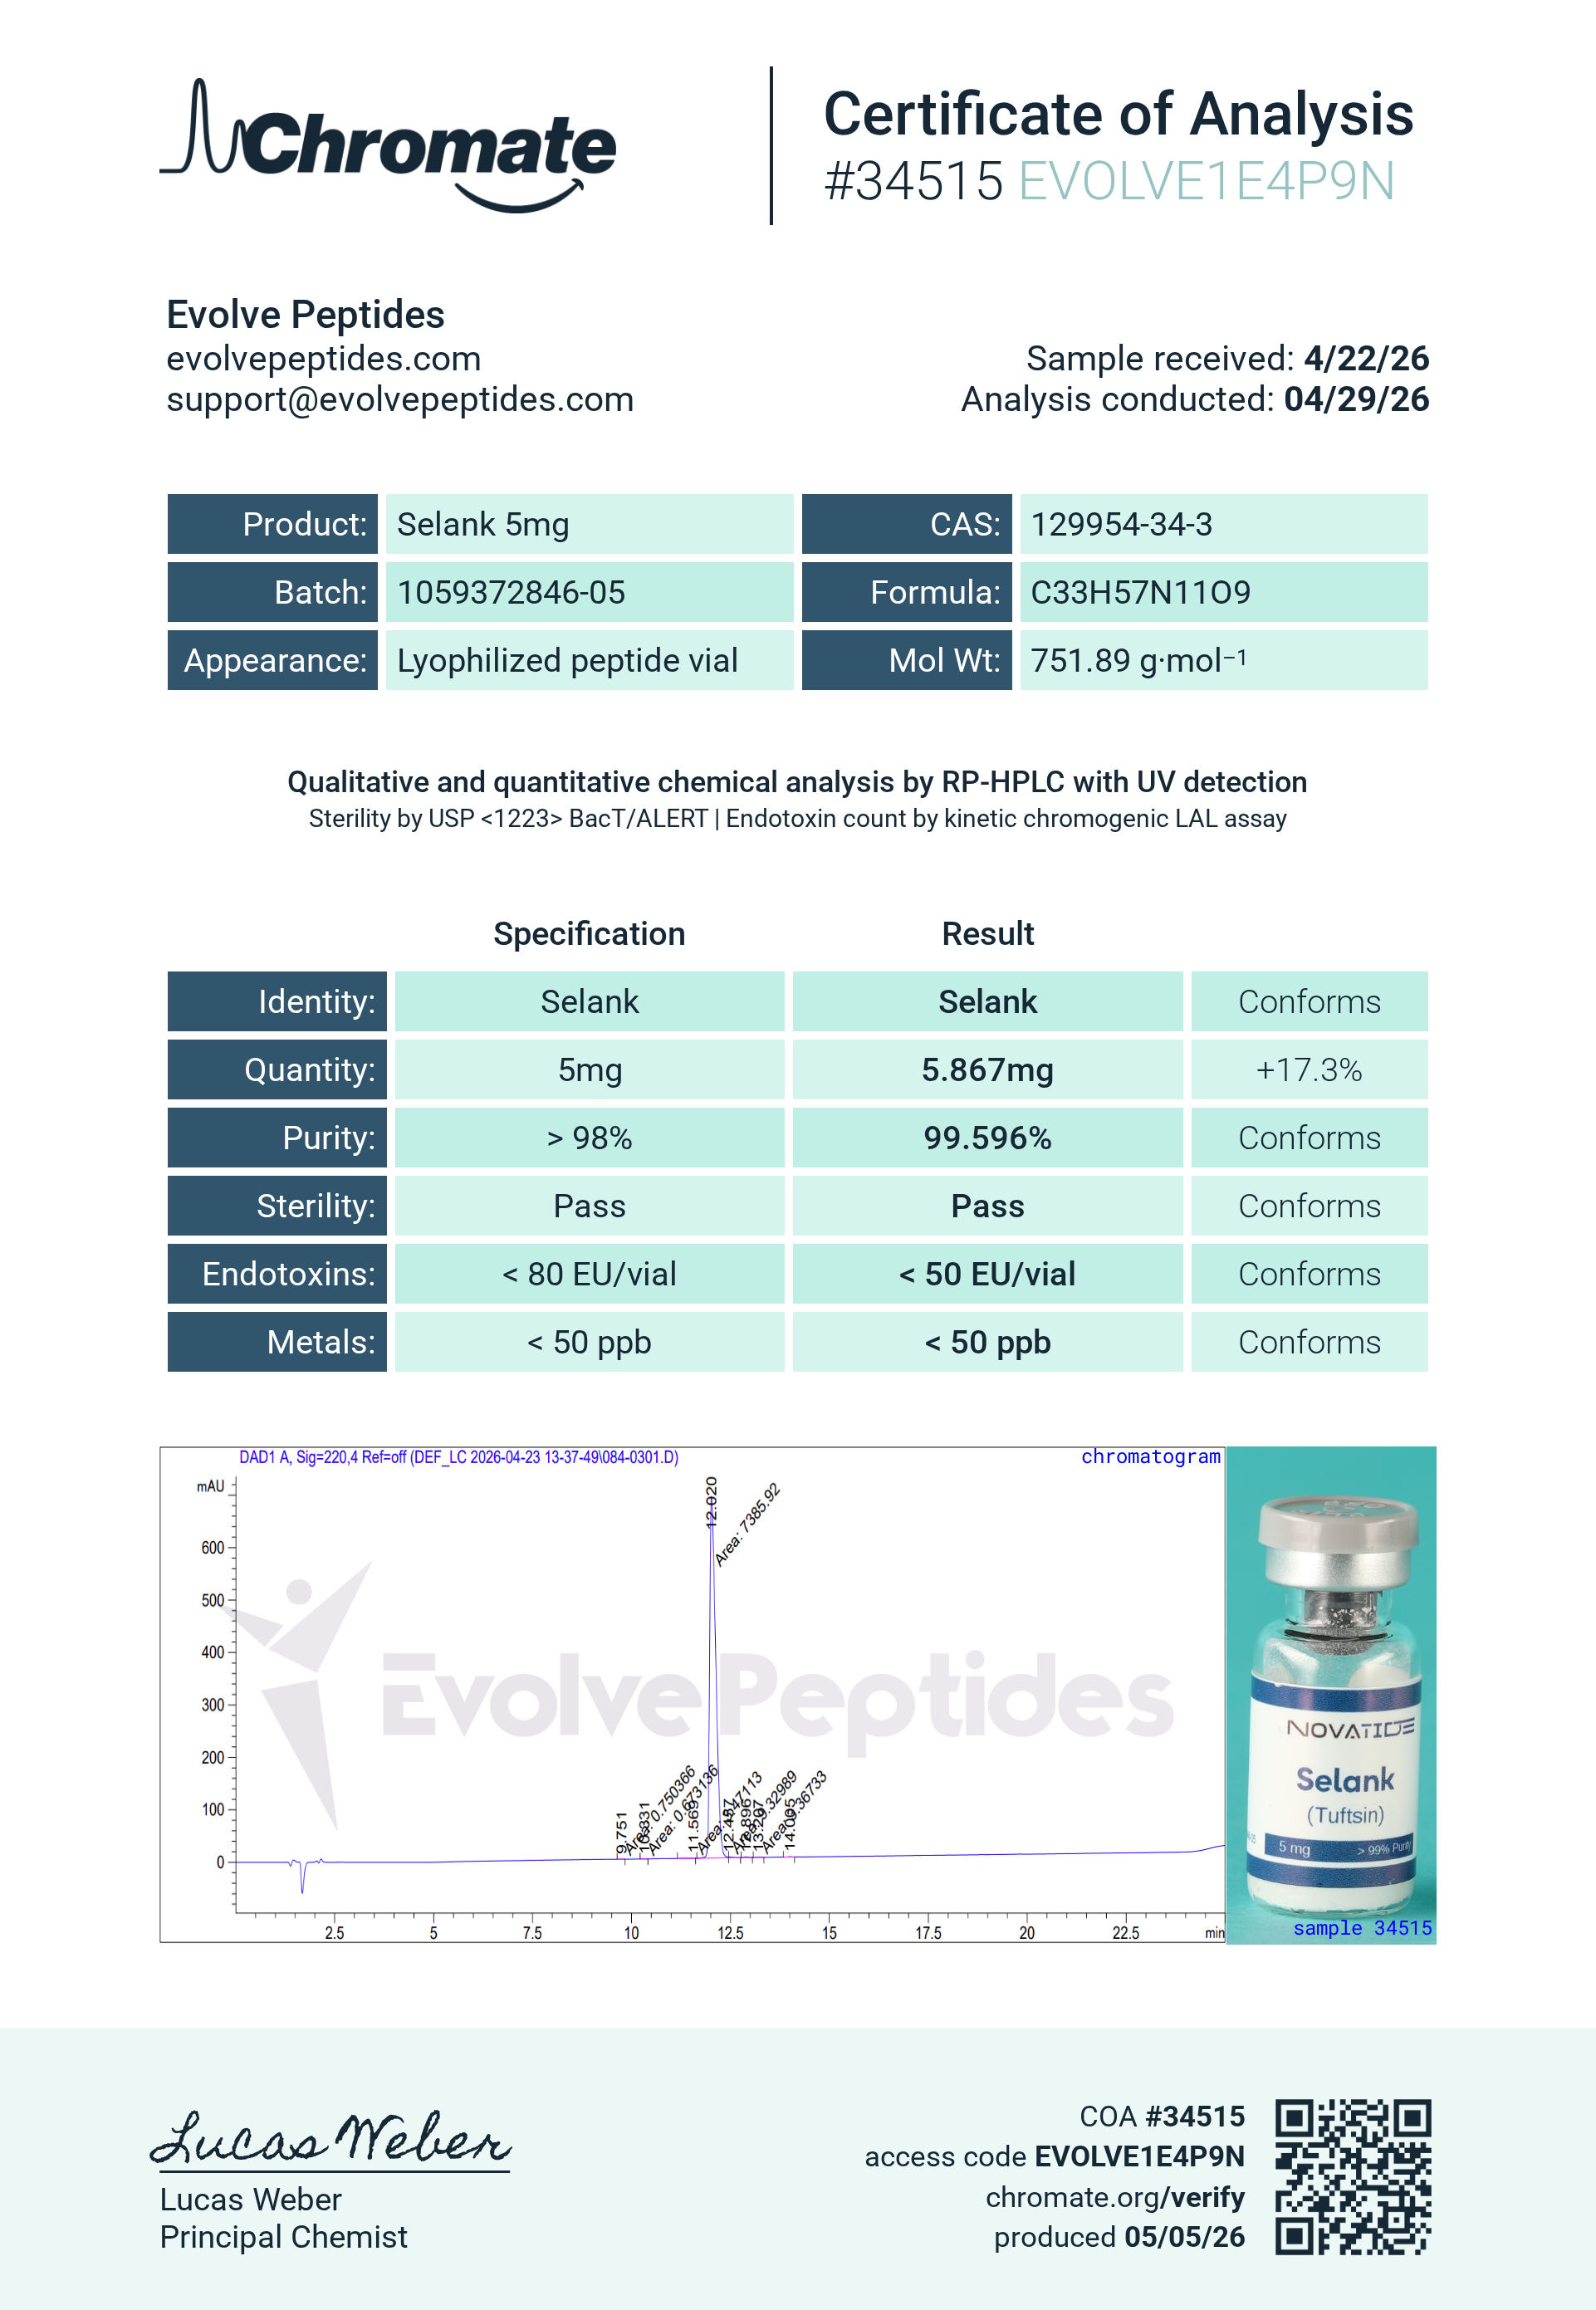
Detection and failure are different: Evolve’s KLOW certificate measures 55.8 EU/vial, which meets its printed <80 EU/vial specification. Conversely, TriVial Bioworks’ NAD+ certificate reports 8.6 EU/vial against <0.5 EU/vial, exceeding that specification despite our borderline label.
Our comparison of peptide laboratories explains why methods and reporting conventions matter. These examples show why a universal cutoff cannot interpret every certificate. The findings also mean 55 is a count of database flags, not a verified count of contaminated or failed batches. The corrected total requires certificate-level reconciliation across the collection.
Names in these examples are printed report attributions. They do not independently establish who manufactured the material or whether other batches share the result.
Were there more findings in 2026 than in 2025?
There are more recorded flags. That alone does not tell us whether endotoxins became more common.
For a matched calendar comparison, we used test dates from January 1 through September 20 in each year. September 2026 is incomplete. Both windows use the same September 20 database snapshot, so this is not a comparison of what the site knew at each historical date.
| Measure in the saved records | 2025 | 2026 |
|---|---|---|
| All published entries in the date window | 11,753 | 70,198 |
| Entries containing an endotoxin result or status field | 438 | 6,712 |
| Legacy adverse-status labels | 4 | 55 |
| Legacy pass labels | 384 | 6,141 |
| Borderline labels, counted separately | 6 | 18 |
| Adverse labels divided by adverse plus pass labels | 4/388, or 1.03% | 55/6,196, or 0.89% |
The flag count grew 13.75 times. The number of records classified as either adverse or pass grew about 16 times. Even the uncorrected figures do not support saying that the contamination rate increased.
These percentages describe the labeling system, not a market failure rate. Numerical results without a recognized label are excluded from that denominator. Some labels conflict with their certificates. The reports were not collected through random market sampling.
Source coverage also changed. Freedom Diagnostics contributes 331 of the 388 pass-or-adverse entries in 2025 and 5,124 of 6,196 in 2026. Other sources have very different mixes of pass, flagged and numerical-only records. More testing, new ingestion sources and selective sharing can change the totals without a change in manufacturing quality.
Which vendors have the most recorded flags?
In the uncorrected 2026 inventory, the largest named groups are below. This is a list of records to investigate, not a ranking of the worst vendors. The denominator shows how little comparable evidence some groups have.
The largest named groups are JEEP with 7 adverse labels among 26 pass-or-adverse entries, GYC with 5 among 12, Uther Peptide with 4 among 18, and Bfflist Amo with 3 among 5. SPB, QST and Caliber each have two adverse labels.
These small, uncorrected denominators cannot support a vendor failure-rate league table. They identify where to check the original reports next.
Another ten flagged entries have no usable vendor grouping in the current database. Some original certificates do name a business, as the Evolve examples show. Missing identity in our database does not mean the laboratory withheld the vendor.
Reports can also repeat evidence. JEEP records 7368 and 11878 point to the same laboratory certificate. SPB records 14132 and 16478 share the reported batch and test date and need certificate-level reconciliation. Separate laboratory tests on the same batch are another category again.
A defensible vendor comparison needs distinct certificates, distinct tested batches, original endotoxin results and comparable testing coverage. A vendor with more public testing has more opportunities to show a finding. An absent finding can also reflect absent testing.
Do particular compounds stand out?
Retatrutide and tirzepatide tie for the largest number of 2026 adverse labels. NAD+ has fewer labels but a larger share among its classified records.
- Retatrutide: 14 adverse labels among 1,279 pass-or-adverse entries, or 1.09%. Four additional borderline labels.
- Tirzepatide: 14 among 559, or 2.50%. Two additional borderline labels.
- NAD+: 11 among 182, or 6.04%. One additional borderline label.
This is a reason to investigate the NAD+ records more closely. It is not evidence that NAD+ causes contamination or that its market risk is six times that of retatrutide. Source selection, manufacturers, formulations and label errors can all affect the comparison. NAD+ is included as a related compound, not classified as a peptide.
What is an endotoxin, in plain English?
Endotoxin is bacterial material that can set off an inflammatory response. It is associated with the outer membrane of Gram-negative bacteria and can remain after bacteria are no longer alive. A purity assay, sterility test and endotoxin assay answer different questions. A high peptide purity percentage does not establish the absence of endotoxin. FDA explanation.
EU means endotoxin units, a measure of biological activity against a reference standard. It is not a count of bacteria and it is not the peptide’s weight.
| Report notation | Plain-English meaning |
|---|---|
| 50 EU/vial | The reported total activity attributed to one vial. |
| 50 EU/mL | Activity per milliliter of the reported solution. The relevant volume and dilution basis are needed to work out a vial total. |
| 5 EU/mg | Activity per milligram of material. This needs the correct mass basis. |
| >1,000 EU/vial | More than 1,000. The exact amount was not established by that reported result. |
| <5 EU/vial | Below the stated reporting boundary. It is not an exact result of five and does not establish zero. |
A report must also show that its method works in the tested material. A formulation can interfere with the assay. A result qualified by failed or unestablished test suitability cannot be interpreted like an ordinary validated measurement. FDA endotoxin testing guidance.
Ten reports behind the graphic
The graphic shows ten per-vial results from the review’s illustration set, ordered by certificate date. It includes retatrutide, tirzepatide and the related compound NAD+. It is a subset of the reviewed examples, not the ten newest findings across the whole database. The numerical results do not by themselves establish that a product failed its specification.
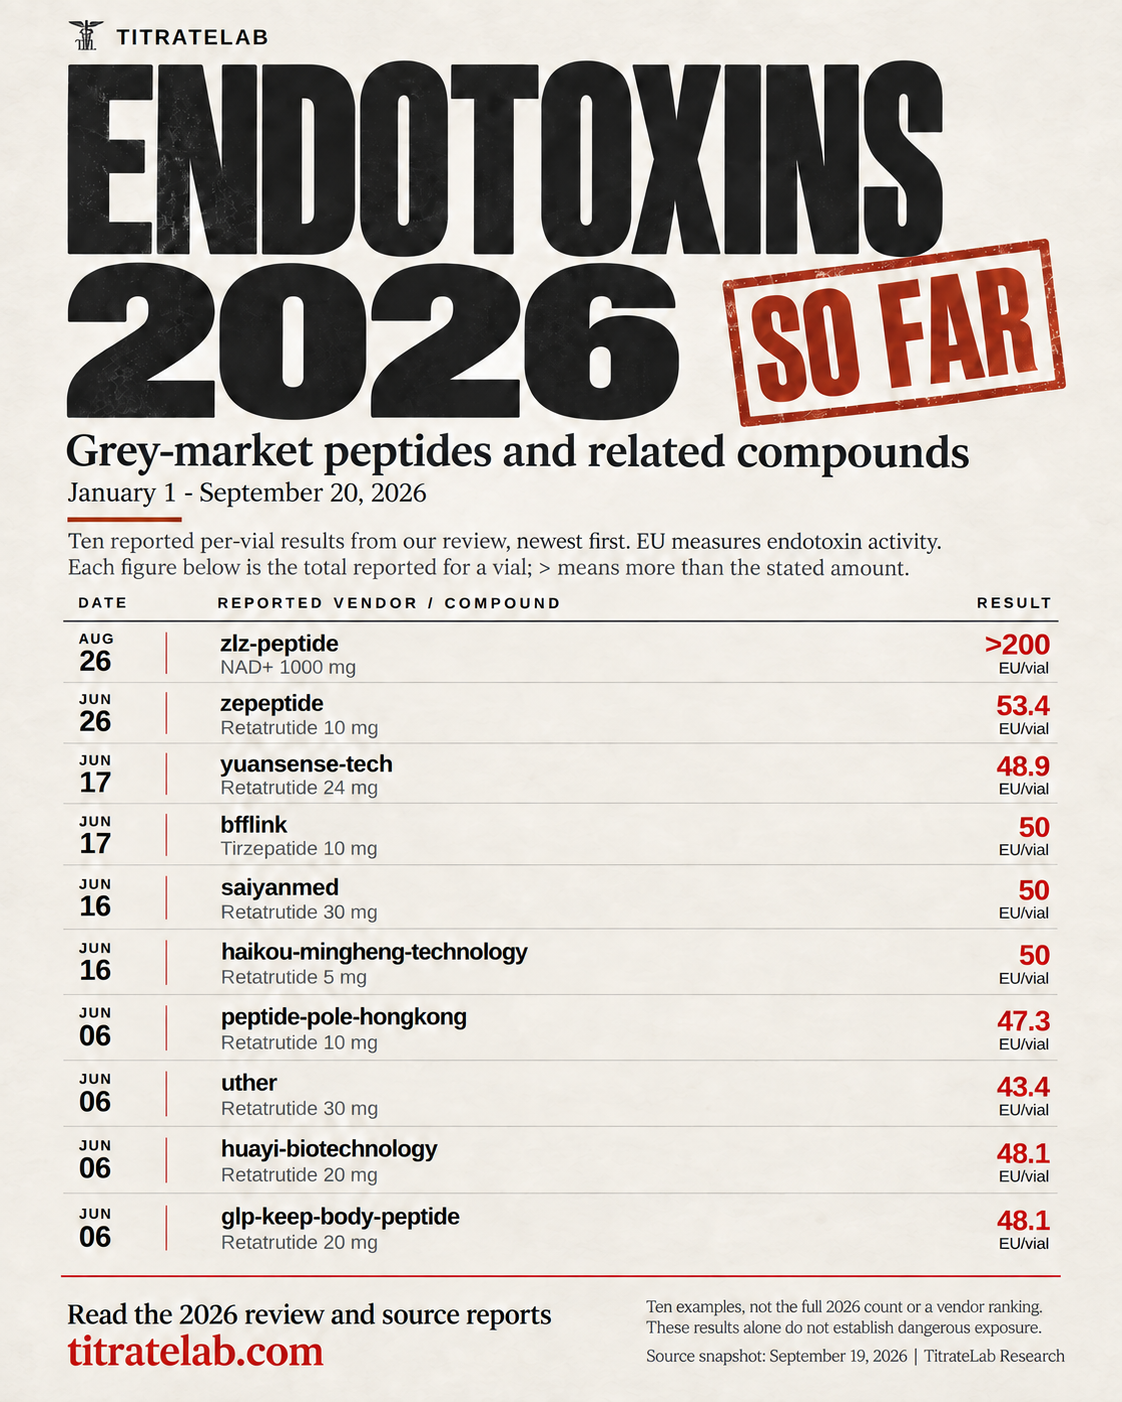
View the ten results and their source links
| Test date | Reported vendor and source | Compound on label | EU/vial |
|---|---|---|---|
| 2026-08-26 | zlz-peptide | NAD+ 1000 mg | >200 |
| 2026-06-26 | zepeptide | Retatrutide 10 mg | 53.4 |
| 2026-06-17 | yuansense-tech | Retatrutide 24 mg | 48.9 |
| 2026-06-17 | bfflink | Tirzepatide 10 mg | 50 |
| 2026-06-16 | saiyanmed | Retatrutide 30 mg | 50 |
| 2026-06-16 | haikou-mingheng-technology | Retatrutide 5 mg | 50 |
| 2026-06-06 | peptide-pole-hongkong | Retatrutide 10 mg | 47.3 |
| 2026-06-06 | uther | Retatrutide 30 mg | 43.4 |
| 2026-06-06 | huayi-biotechnology | Retatrutide 20 mg | 48.1 |
| 2026-06-06 | glp-keep-body-peptide | Retatrutide 20 mg | 48.1 |
What is the median amount?
The 48.9 EU/vial median and 92.5 EU/vial mean describe only a selected illustration set of 14 exact per-vial results. They do not describe every 2026 test, every flagged report or a typical vial bought from the market.
Five other illustrated results are lower bounds in EU/vial. The remaining result is in EU/mL and carries a test-suitability qualification. None belongs in an ordinary exact-value per-vial average.
Within that same illustrative set:
| Compound | Exact per-vial results | Median EU/vial |
|---|---|---|
| Retatrutide | 9 | 48.9 |
| Tirzepatide | 4 | 45.2 |
| NAD+ | 1 | 656.9, a single observation |
The distinction matters. Those examples were selected from flagged records. The broader database also contains low measurements and results reported only as below a limit. Excluding those changes the population being summarized. Excluding high lower-bound results can pull an average in the other direction.
We extracted 546 numerical entries in the 2026 window for further review, keeping units and greater-than or less-than signs separate. That extraction is incomplete and needs source checking. A reliable all-2026 median is not established by this audit.
What number is actually dangerous?
There is no single EU/vial number that predicts whether someone will be harmed. The amount received, route, timing and individual response matter. Laboratory specifications and pharmaceutical acceptance limits provide context, but they are not personal injury thresholds.
FDA gives a maximum of 5 EU/kg received within one hour for most drugs. For a 70 kg adult, about 154 lb, that is 350 EU. Intrathecal and epidural administration have a much stricter limit of 0.2 EU/kg. Product-specific limits depend on the maximum dose. FDA quality correspondence.
Crossing the relevant acceptance limit is a quality concern. Being below this illustrative benchmark does not prove safety, and crossing it does not tell us that a particular person suffered permanent damage.
Human experiments help explain the uncertainty. In a small study of ten healthy men, the same total endotoxin exposure produced different inflammatory responses when given as a rapid intravenous dose versus a four-hour infusion. The study measured inflammatory responses, not a universal threshold for lasting injury. These intravenous experiments cannot directly predict responses to subcutaneous peptide use. Taudorf et al., 2007.
In a separate dose-response experiment, increasing intravenous endotoxin doses produced stronger symptoms and inflammatory effects. The studies report doses in nanograms per kilogram. There is no universal mass-to-EU conversion that lets us turn them into a damage calculator for these vials. Suffredini et al., 1999.
Serious reactions are nevertheless documented. FDA investigated patients who experienced adverse reactions after compounded glutathione injections made with an ingredient containing excessive endotoxin. Reported effects included chills, fever and low blood pressure. That is clinical evidence of the hazard, not evidence that any of the peptide reports in this review caused those events. FDA investigation.
A whole vial is not the same as one exposure
If endotoxin is evenly distributed, a fraction containing one fifth of a vial’s contents contains one fifth of its total endotoxin activity. This is an exposure calculation, not a safe-dose recommendation.
For the illustrated median of 48.9 EU/vial, that fraction would contain 9.78 EU. For the source-checked JEEP result of 2,306 EU/vial, the same fraction would contain 461.2 EU. The latter exceeds the 350 EU contextual benchmark for a 70 kg adult without involving an entire vial.
An entire vial is not necessarily needed to reach the benchmark. It depends on the measured activity in that vial.
Compound amount also matters. The published retatrutide phase 2 trial included a 4 mg weekly treatment arm under a clinical protocol. We can use 4 mg as a research reference, not as a recommended or established typical grey-market dose. Jastreboff et al., 2023.
A retatrutide report labeled 10 mg has a result of 53.4 EU/vial. Under the stated assumptions, a 4 mg fraction corresponds to 21.36 EU. The whole labeled vial represents 2.5 such fractions, not one. This assumes the labeled amount is correct and both substances are evenly distributed.
For the nine illustrative retatrutide reports, dividing each result by its own labeled peptide amount gives a median of 2.405 EU per labeled mg. Applying the 4 mg research reference to each record gives a median modeled exposure of 9.62 EU. That is a calculation within nine selected reports, not a measured patient exposure or a grey-market safety estimate.
We do not combine amounts used on different days and compare their sum with a one-hour pharmaceutical limit. These reports also cannot establish the effects of repeated long-term exposure.
Can filtering remove endotoxins?
Some specialized filters can. A generic sterile syringe filter does not come with a reliable endotoxin-removal percentage. Removing bacteria and removing the endotoxin they leave behind are different tasks.
The relevant research shows why pore size alone is insufficient:
Vanhaecke et al. (1989) found that retention depended on the filter and liquid. Nylon filters performed well in glucose solution, while salt reduced performance. Cellulose ester filters did not reliably remove endotoxin.
Gerba and Hou (1985) showed removal with charge-modified media, with performance affected by pH, salt and organic material.
Bononi et al. (2008) compared positively charged and noncharged 0.2-micrometer membranes. With purified endotoxin in water, charged membranes generally produced effluent below 0.03 EU/mL from a nominal 1 EU/mL challenge. That is roughly 97% or greater removal under those conditions. Noncharged membranes with the same pore size did not maintain comparable retention. The study did not test home-filtered peptide formulations, and one author was affiliated with a filter manufacturer.
FDA’s aseptic-processing guidance likewise distinguishes sterilizing filtration from reliable endotoxin removal. FDA guidance.
These studies do not establish that an unspecified filter removes 70% from retatrutide, tirzepatide or NAD+ solutions. They do not establish peptide recovery or the sterility of a final preparation. Validating a process requires measurements in the actual formulation, including the final material, rather than borrowing a percentage from another experiment.
What if removal really were 70%?
A hypothetical 70% reduction leaves 30% of the starting activity. The arithmetic is straightforward; whether that reduction happened is the unresolved experimental question.
| Educational exposure scenario | Before filtration | If 70% removal actually occurred |
|---|---|---|
| One fifth of a 48.9 EU/vial result | 9.78 EU | 2.93 EU |
| 4 mg reference fraction of the 53.4 EU, labeled 10 mg retatrutide report | 21.36 EU | 6.41 EU |
| One fifth of the 2,306 EU/vial JEEP result | 461.2 EU | 138.36 EU |
These calculations assume uniform distribution, no additional contamination and no change in the fraction of product represented. They are sensitivity scenarios, not observed filtration results. A 70% reduction in assay activity also cannot be translated into a 70% reduction in health risk.
Without evidence for the actual process, none of these reports should be represented as having a lower post-filtration result. Even a demonstrated reduction would address only one part of product quality.
Method, corrections and evidence access
This review uses a read-only snapshot taken September 20, 2026 at 20:44 UTC. We counted published report entries by test date and applied the current ledger’s status classifier consistently to the two calendar windows. Borderline entries remain separate. Blank statuses are not treated as passes. Missing dates and dates outside the windows are excluded from the year comparison.
Vendor groups use existing canonical identities where available, with raw labels as a fallback. Compound aliases were normalized for the principal comparisons. We preserved units and inequality signs in numerical extraction. Source checks found both classification and extraction problems, including a stored value of 87 where the source text says 0.087 EU/mL. The production database was not changed during this editorial audit.
The vendor and compound counts deliberately retain the original labels so the existing ledger can be audited. They are not corrected estimates. Certificate deduplication, remaining source reconciliation and broader numerical validation are required before publishing a final vendor ranking or an all-2026 detection count.
The literature review targeted human exposure studies, pharmaceutical guidance and original filtration experiments. It is a focused evidence review, not an exhaustive systematic review or clinical assessment.
Explore the report collection and TitrateLab’s methodology. The live ledger may still display labels discussed in this audit; consult the linked original certificates for the reviewed examples.
Investigate a specific batch
Find your batch to search the available reports. Our Batch Finder case study shows how an investigation works. TitrateLab Pro includes full COA records and supplier history for deeper research.
Prepared with AI assistance for TitrateLab Research Desk. Data and literature reviewed September 20, 2026. Source reconciliation remains open; this is an audit of available evidence, not a completed contamination census or a clinical assessment. Send corrections with the report number to [email protected].