Sermorelin leads at +10%. IGF-1 LR3 leads at +20%.
Sermorelin most often exceeds stated content by more than 10%: 224 of 318 reports (70.4%); at a 20% margin, IGF-1 LR3 leads at 121 of 249 (48.6%). These six-month database rankings are sensitive to collection coverage, with 94.1% of records drawn directly from the Freedom Diagnostics source.
Sermorelin / above +10%
70.4%
IGF-1 LR3 / above +20%
48.6%
Direct Freedom Diagnostics source
94.1%
Evidence
30,639 report records across 32 categories; dates April 29–October 29, 2026; at least 100 records per category; analyzed October 29
Limits
Nonrandom report records, not independent purchases or market prevalence. Original-source spot checks cannot rule out every extraction error or repeated assay.
Six-month database analysis30,639 report records across 32 categories; dates April 29–October 29, 2026; at least 100 records per category; analyzed October 29 · reviewed 2026-10-29
The verdict
Sermorelin leads at +10%. IGF-1 LR3 leads at +20%.
Sermorelin most often exceeds stated content by more than 10%: 224 of 318 reports (70.4%); at a 20% margin, IGF-1 LR3 leads at 121 of 249 (48.6%). These six-month database rankings are sensitive to collection coverage, with 94.1% of records drawn directly from the Freedom Diagnostics source.
The median reported difference is +16.3%. This is a descriptive database result, not the probability that a purchased vial will be overfilled.
IGF-1 LR3 / above +20%48.6%
121 of 249 included IGF-1 LR3 report records
IGF-1 LR3 leads when the threshold is more than 20% above stated content. Frequency above a chosen margin and the largest individual result answer different questions.
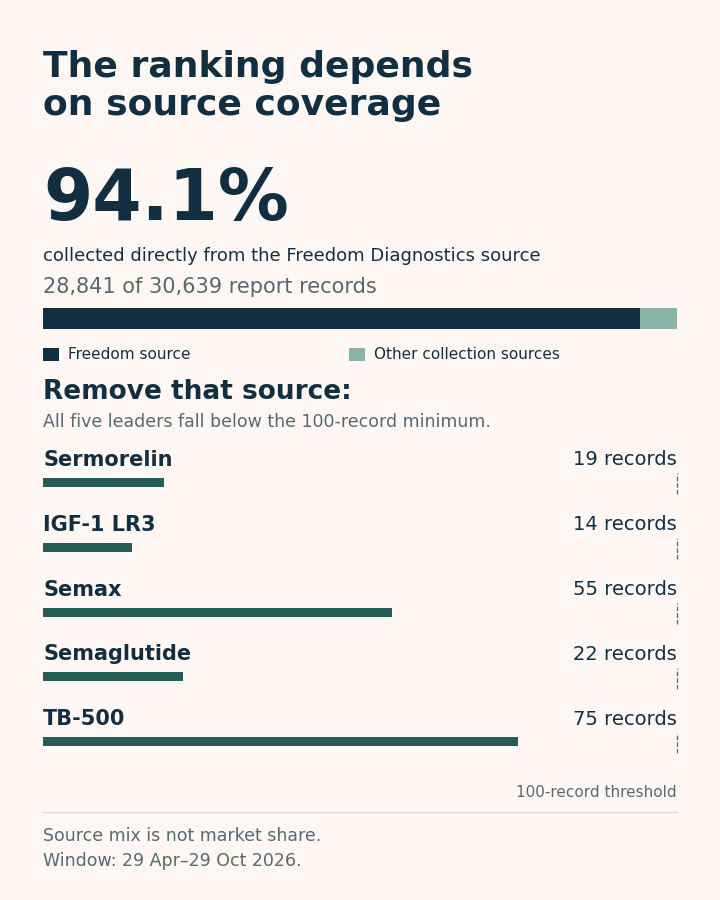
Direct Freedom Diagnostics source94.1%
28,841 of 30,639 included records
Removing records collected directly from this source puts all five leaders below the 100-record minimum. Other collection channels may also republish Freedom reports, so this is a collection-source sensitivity check, not a complete laboratory exclusion.
The same five categories, two thresholds. Percentages count collected report records; exact numerators and denominators are below. Neither threshold is a safety or manufacturing standard.
The counts behind the chart
We ranked 32 categories with at least 100 qualifying records each, using report dates April 29–October 29, 2026. “Most often” means the largest share above the chosen margin, rather than the greatest number of excess milligrams.
Across all qualifying results, including underfills, sermorelin’s median result is 16.3% above stated, versus 19.0% for IGF-1 LR3. A category can therefore exceed a smaller margin more often while another more often exceeds a larger one.
Retatrutide exceeds +10% in 3,981/7,701 reports (51.7%); tirzepatide in 1,809/3,770 (48.0%). Neither belongs in this leading five under the chosen definition.
One collection source dominates
28,841 of 30,639 records were collected directly from the Freedom Diagnostics source. Excluding that source leaves every member of the leading five below the 100-record minimum. The graphic shows how little coverage remains for each.
Collection channels are not necessarily different laboratories: vendor libraries and community sources may also republish Freedom reports. This checks dependence on the direct collection source, not complete exclusion of that laboratory.
Among categories still eligible after that exclusion, MOTS-C leads at 57/119 (47.9%). This change shows why the main ranking cannot be treated as the odds for a vial purchased in the wider market.
Names matter, too. Leaving “IGF-LR3” separate produces 170/234 (72.6%). Grouping the 15 qualifying “IGF-1 LR3” records lowers it to 171/249 (68.7%). We combine those documented LR3 names, while retaining distinct CJC-1295 DAC forms and Adamax molecular-mass variants.
Method and source checks
We calculated 100 × (measured mass ÷ stated mass − 1) from positive, explicit mass quantities in a frozen October 29 snapshot. Blends, nonpeptides, unusable units or dates, known duplicate reports and unresolved source conflicts were excluded. Finnrick records were excluded because their stored comparison can use a batch claim rather than the sampled vial’s label. No upper overfill cap was imposed.
Collapsing possible repeats with matching source, compound, date, batch, quantities and purity preserves the first four positions; Eloralintide replaces TB-500 in fifth. Matching fields alone do not prove a shared assay. Glutathione capitalization variants were combined; other unresolved identities remained separate.
The public aggregate supports recalculating these rates; the curated record-level corpus remains proprietary. For individual extremes, see five original overfill reports. For a product-specific claim, inspect its original COA.
Prepared by the TitrateLab Research Desk with AI-assisted data analysis and editorial tooling; reviewed October 29, 2026. TitrateLab collected these reports and did not perform the assays. Report a source or calculation correction.
Vendor and manufacturer names are used descriptively to identify parties in the documentary record; inclusion is not endorsement. Think a passage misrepresents the record? [email protected].
TitrateLabPRO
Look beyond a compound’s average.
An aggregate cannot tell you what is in a particular vial. Use Pro to examine source-linked results and available batch records for the specific product you are researching.
121,194published COA report entries
01Inspect the source report
Check the laboratory, report date, stated strength and measured amount.
02Compare available results
Review related batch records and the supplier’s testing history.
03Keep gaps visible
Distinguish a measured sample from an untested product or a market-wide claim.
TitrateLab
You must be 21 or older to enter.
TitrateLab provides research-use information on peptides for adults. Confirm your age to continue.
For research purposes only. Not for human consumption. By entering you agree to our Terms & Privacy.